https://cdn.tradingfinder.com/file/5...4-by-tflab.zip
https://www.metalsmine.com/thread/13...trader-5-tflab
https://www.forexfactory.com/thread/...-in-metatrader
Prop Firm DrawDown Protector : Prop Firm Capital Protection Expert MT4 | Forex Money Management: Forex Trade Management Expert MT4 |ICT Concepts Indicator MT4 | Smart Money Concepts Expert MT4| Smart Money Trap Scanner | Get a free Expert Advisor license via Telegram and WhatsApp
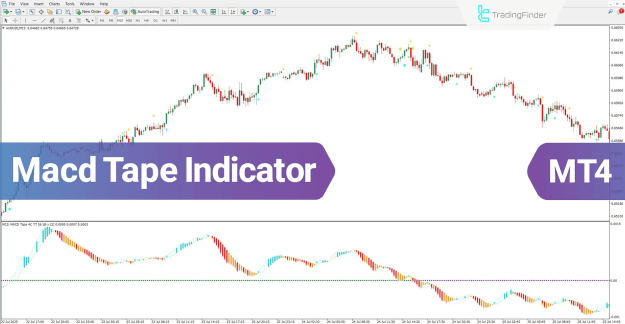
MACD Tape Indicator Overview and Categories
This advanced trading tool falls into several key analytical categories, making it a versatile choice for various trading styles.
- Primary Function: Momentum and Trend-Following Oscillator
- Trading Application: Generates buy and sell signals and forecasts potential market reversals.
- Platform Compatibility: Developed as a custom indicator for the MetaTrader 4 (MT4) platform.
- Recommended Trading Skill Level: Elementary to Intermediate.
- Suitable Timeframes: A multi-timeframe indicator, effective for scalping, day trading, and swing trading.
- Applicable Markets: A versatile tool for analyzing Forex, Cryptocurrency, Indices, Commodities, and Share Stocks.
Generating Trading Signals with the MACD Tape
A core capability of the MACD Tape oscillator is its ability to generate valid entry and exit signals. These signals are primarily based on the crossover between the MACD line and its signal line, with clear visual markers on the chart.
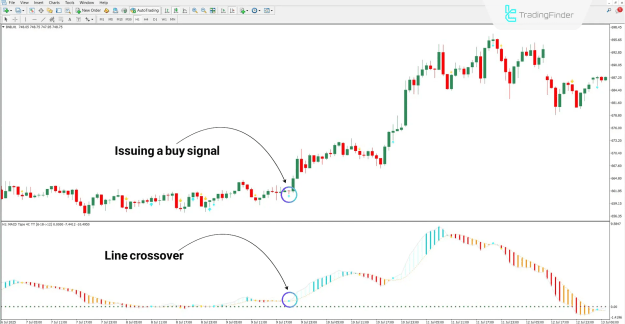
Identifying a Buy Signal
A bullish trading opportunity is presented when the MACD line crosses above the signal line. The indicator clearly marks this event with a distinct blue arrow, typically placed below the price action.
- Signal Confirmation: The emergence of light and dark blue histogram bars following the crossover confirms the strength and sustainability of the new bullish trend.
- Market Example: On a 1-hour Binance Coin (BNB) chart, the MACD Tape oscillator accurately detects the line crossover and issues a timely buy signal, with the subsequent blue histograms highlighting the strong upward momentum.
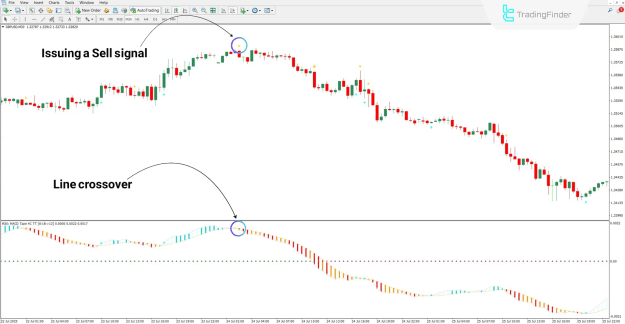
Identifying a Sell Signal
Conversely, a bearish trading setup is confirmed when the MACD line crosses below the signal line. This sell signal is indicated by a yellow arrow, usually positioned above the price candle.
- Signal Confirmation: The appearance of red and orange histogram bars after the crossover validates the strength of the bearish trend, indicating increasing downward momentum.
- Market Example: On a 30-minute chart of the GBP/USD pair, the indicator successfully identifies the crossover and issues a sell signal. The dominant red and orange histograms provide clear visual confirmation of the bearish pressure.
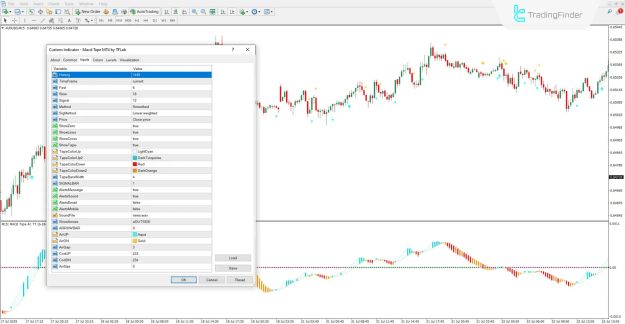
Configuring the MACD Tape Indicator Settings
The MACD Tape oscillator is highly customizable, allowing traders to tailor its parameters to their specific strategy. The settings can be broadly grouped into several key areas:
Core Calculation Parameters
These settings control the fundamental mathematical calculations of the indicator.
- Fast EMA: The period for the faster-moving average.
- Slow EMA: The period for the slower-moving average.
- Signal SMA: The period for the signal line smoothing.
- Method & SigMethod: The type of moving average used for the MACD and signal line calculations (e.g., Simple, Exponential).
- Price Type: The price point used in the calculations (e.g., Close, Open, Typical Price).
Visual Display and Alerts
These settings manage the on-chart appearance and notification systems.
- Show Arrows: Toggles the display of buy/sell signal arrows.
- Arrow Colors (ArrUP, ArrDN): Defines the color for buy and sell arrows.
- Histogram Colors (TapeColorUp, TapeColorDown, etc.): Allows customization of the bullish and bearish histogram color bands.
- Alerts: Enables pop-up, email, and mobile notifications for new trading signals.
Conclusion
The MACD Tape oscillator stands out as a practical and enhanced tool for technical analysis. By transforming market momentum into an intuitive, color-coded histogram, it allows for quicker and more informed trading decisions. The addition of automated arrow signals for line crossovers further streamlines the process of identifying high-probability trading opportunities across various financial markets and timeframes.