This enhanced tool moves beyond merely marking points on the chart. It displays continuous levels where significant price reactions have historically occurred, establishing them as crucial zones for potential reversal or breakout in current market conditions.
https://cdn.tradingfinder.com/file/5...5-by-tflab.zip
https://www.metalsmine.com/thread/13...n-metatrader-4
https://www.forexfactory.com/thread/...-in-metatrader
Prop Firm DrawDown Protector : Prop Firm Capital Protection Expert MT5 |Forex Money Management: Forex Trade Management Expert MT5 | ICT Concepts Indicator MT5 |Smart Money Concepts Expert MT5 | Smart Money Trap Scanner | Get a free Expert Advisor license via Telegram and WhatsApp
Comprehensive Indicator Specifications
This indicator serves as a multi-purpose tool for technical analysts, categorized for its unique functionalities.
Indicator Profile:
- Platform: MetaTrader 5 (MT5)
- Trading Skill Level: Intermediate
- Primary Categories: Support & Resistance, Trading Assist, Levels
- Core Functions: Breakout and Reversal Identification
- Timeframe Compatibility: Multi-Timeframe Analysis
Recommended Trading Style:
- Intraday Trading
Universal Market Application:
The Brooky PSAR Levels indicator is effective across all major financial markets, including:
- Forex currency pairs
- Cryptocurrency assets
- Stock CFDs and indices
- Commodity markets
Analytical Framework and Trading Mechanics
The indicator calculates and visually presents two distinct, dynamically updating market levels using a color-coded system for immediate recognition.
Defined Market Levels:
- Resistance (Upper PSAR): Represented by one color, this level acts as a ceiling during uptrends. When price tests this area, it often encounters increased selling pressure, leading to either a price reversal or a decisive breakout.
- Support (Lower PSAR): Marked by another color, this level functions as a floor during downtrends. A approach to this zone typically attracts buying interest, raising the probability of a price rebound or a consolidation.
These automatically updated levels provide a robust framework for determining strategic trade entries, exits, and optimal stop-loss placement.
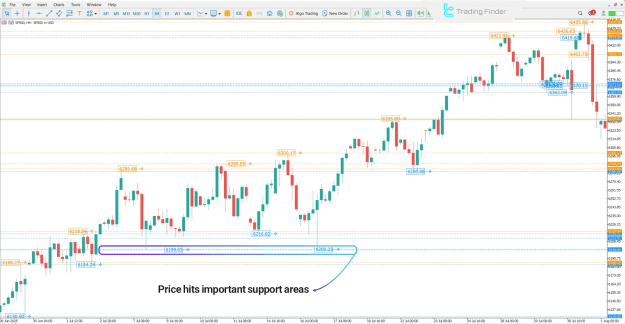
Strategic Buy-Entry in an Uptrend
An analysis of the S&P 500 index on a 4-hour chart demonstrates a practical application:
- During a established downtrend, the price approaches the identified dynamic support level.
- The trade trigger occurs when a confirmed positive price reaction is observed at this level—such as a bullish reversal candlestick pattern—creating high-probability conditions for a buy-entry.
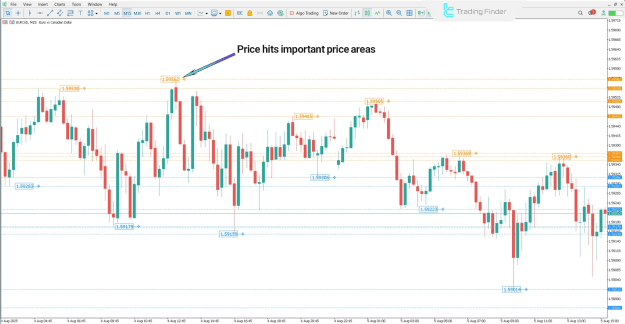
Strategic Sell-Entry in a Downtrend
A review of the EUR/CAD pair on a 15-minute timeframe illustrates the sell-side setup:
- The price rallies to meet a significant dynamic resistance zone.
- The emergence of bearish reversal signals at this level indicates waning bullish momentum. This technical setup increases the probability of a new downtrend initiating, presenting a clear sell-entry opportunity.
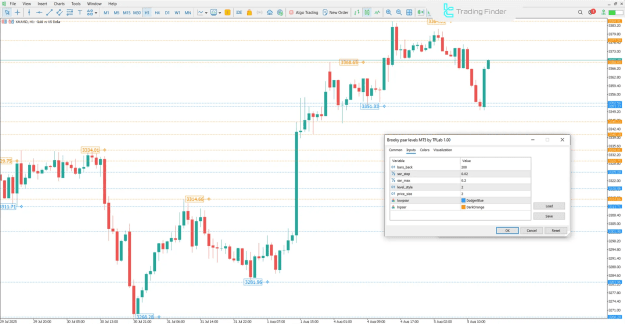
Customization and Configuration Settings
The indicator offers a customizable settings panel to align with various trading strategies and asset volatilities.
Key Adjustable Parameters:
- Bars Back: Determines the number of historical candles used in the calculation.
- SAR Step & SAR Max: These core parameters control the sensitivity and acceleration of the Parabolic SAR calculation, allowing traders to adjust for different market conditions.
- Visual Customization: Settings for Level Style and Price Size enable traders to modify the visual presentation of the levels and their labels for optimal chart clarity.
- Calculation Variables: Internal parameters such as LowPsar and HiPsar manage the precise calculation of the support and resistance levels, respectively.
Conclusion
The Brooky PSAR Levels indicator is a powerful analytical tool that builds upon the proven PSAR formula to deliver clear, dynamic support and resistance levels directly onto the price chart.
Its primary value lies in its dual function: determining the underlying trend direction while simultaneously identifying significant zones for potential reversal or breakout.
Integrating these dynamically calculated levels with price action analysis significantly enhances the accuracy of technical analysis and strategic decision-making, providing a distinct advantage in both bullish and bearish market environments.