https://cdn.tradingfinder.com/file/5...5-by-tflab.zip
https://www.metalsmine.com/thread/13...trader-4-tflab
https://www.forexfactory.com/thread/...-in-metatrader
Prop Firm DrawDown Protector : Prop Firm Capital Protection Expert MT5 |Forex Money Management: Forex Trade Management Expert MT5 | ICT Concepts Indicator MT5 |Smart Money Concepts Expert MT5 | Smart Money Trap Scanner | Get a free Expert Advisor license via Telegram and WhatsApp
Core Concept and Structure
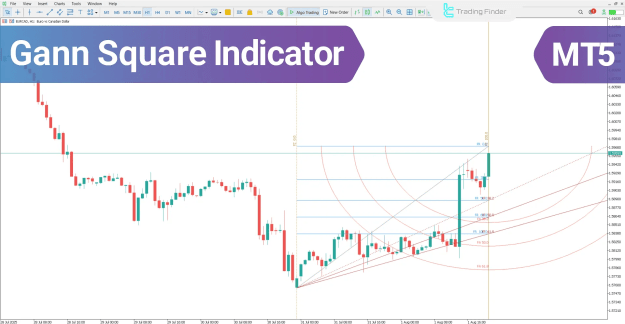
The indicator integrates several Gann-based analytical elements, including:
- Gann Angles – Define the strength and slope of a trend.
- Gann Square – Aligns price levels with time cycles.
- Gann Fans – Highlight diagonal areas of potential support and resistance.
- Time Arcs – Visualize the relationship between price movement and time intervals.
Together, these tools create a comprehensive framework for evaluating trend behavior, market cycles, and potential reversal areas.
Key Characteristics
The Gann Square Indicator is part of multiple MetaTrader 5 indicator categories, including:
- Signal & Forecast Indicators
- Breakout and Reversal Indicators
- Multi-Timeframe Analysis Tools
- Intraday Trading and Gann Analysis Tools
It’s compatible with Forex, Crypto, and Stock markets, allowing traders to analyze multiple instruments and timeframes with customizable parameters.
How It Works
1. Time–Price Synchronization
When price movement aligns with time progression, it often signals a potential trend shift or key reversal point.
2. Gann Angle Reactions
Touches or breakouts at critical Gann angles serve as indicators of trend momentum and strength.
3. Price–Time Confluence
The intersection of Gann fan lines, horizontal price levels, and vertical time zones often reveals sensitive areas where strong market reactions may occur.
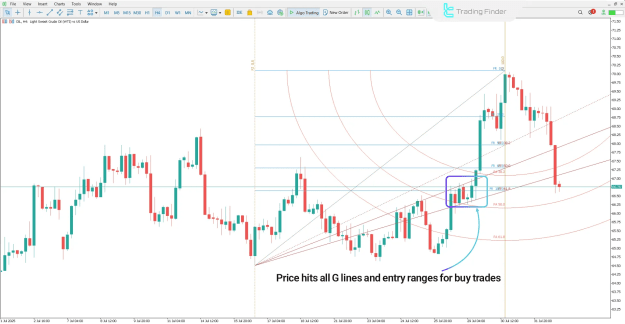
Uptrend Scenario
In an uptrend (e.g., OIL Index on a 4-hour chart), when price surpasses the 61.8% retracement and breaks higher Gann angles (such as 38.2), it signals bullish strength and market demand.
If this movement coincides with ascending fan lines and time cycle alignment, it strengthens the signal for a long entry.
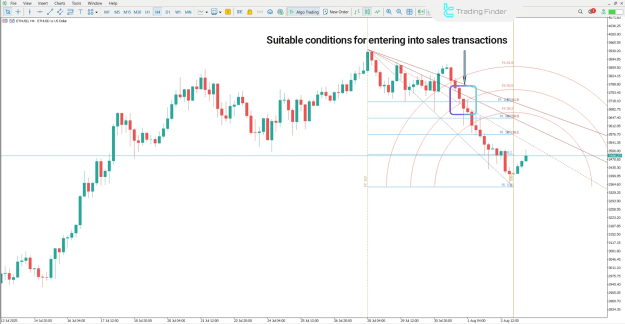
Downtrend Scenario
In a downtrend (e.g., ETH/USD on a 4-hour chart), when price falls below the 61.8% retracement and breaks lower Gann angles, it reflects increasing selling pressure and trend weakness.
If this move aligns with descending Gann fans or key time zones, it indicates the continuation of bearish momentum.
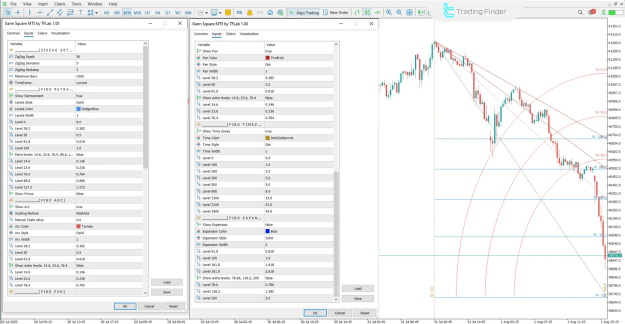
Indicator Settings
ZigZag Configuration
- Depth / Deviation / Backstep – Control swing sensitivity and reduce false pivots.
- Maximum Bars / Timeframe – Define analysis range and data scope.
Fibonacci Components
Includes Retracement, Arc, Fan, Expansion, and Time Zones modules:
- Standard Levels: 38.2%, 50%, 61.8%, 100%
- Extended Levels: 14.6%, 23.6%, 76.4%, 88.6%, 127.2%, 161.8%, 261.8%
- Fully customizable for color, style, and width.
Application and Use Cases
- Identify reversal and breakout zones with time–price harmony.
- Optimize entry and exit points based on time cycles.
- Integrate with ICT and Smart Money Concepts (SMC).
- Enhance multi-timeframe precision in professional trading systems.
Conclusion
The Gann Square Indicator is a comprehensive analytical solution combining geometric, temporal, and price-based methodologies.
Through the integration of Gann Angles, Squares, Fans, and Time Arcs, it enables traders to anticipate critical turning points and trend transitions with higher accuracy.
Ideal for professionals who rely on structured market geometry and time-based forecasting, this tool enhances analytical clarity and strategic precision in MetaTrader 5 trading workflows.