This powerful indicator integrates multiple geometric and time-based components, including Gann Angles, the Gann Square, Gann Fan, and Time Arcs, with each element contributing a unique perspective to comprehensive market analysis.
https://cdn.tradingfinder.com/file/5...4-by-tflab.zip
https://www.metalsmine.com/thread/13...trader-5-tflab
https://www.forexfactory.com/thread/...-in-metatrader
Prop Firm DrawDown Protector : Prop Firm Capital Protection Expert MT4 | Forex Money Management: Forex Trade Management Expert MT4 |ICT Concepts Indicator MT4 | Smart Money Concepts Expert MT4| Smart Money Trap Scanner | Get a free Expert Advisor license via Telegram and WhatsApp
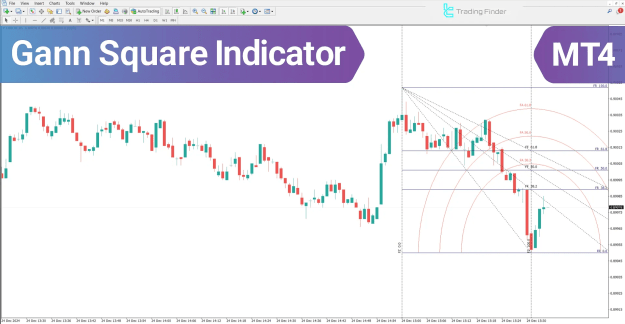
Overview of the Gann Square Indicator
The Gann Square Indicator is an analytical framework that combines price movement with time cycle analysis. Its primary function is to pinpoint key market entry and exit points. The indicator's methodology is built upon three foundational pillars:
- Symmetry of Time and Price: A high probability of a trend reversal emerges when time and price achieve equilibrium at a congruent level.
- Angles and Diagonal Lines Analysis: The breach or touch of significant Gann angles serves as a critical signal, indicating either sustained trend strength or an impending change in market direction.
- Price-Time Confluence: Powerful market reactions are often triggered at the intersection of Gann fan lines, horizontal price levels, and vertical time lines.
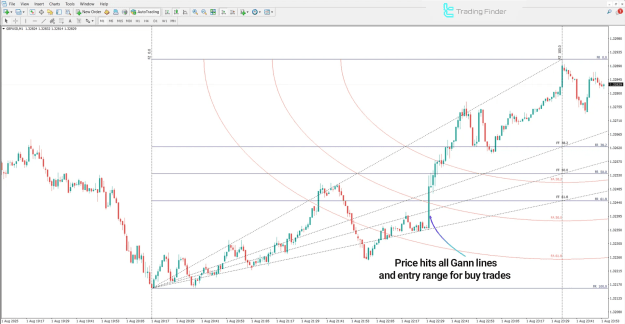
Applying the Indicator in an Uptrend
The following analysis is based on the GBP/USD currency pair on a 1-minute timeframe. During a confirmed uptrend, the indicator provides specific bullish signals:
- Price Position: Sustained price action above the 61.8% Fibonacci level demonstrates underlying bullish momentum.
- Angle Breakouts: The successful breach of ascending Gann angles, such as the 50-level angle, confirms buying pressure and dominant market demand.
- Signal Confluence: A robust long entry signal is generated when ascending Gann fan lines converge with primary time cycles, creating a high-probability trading zone.
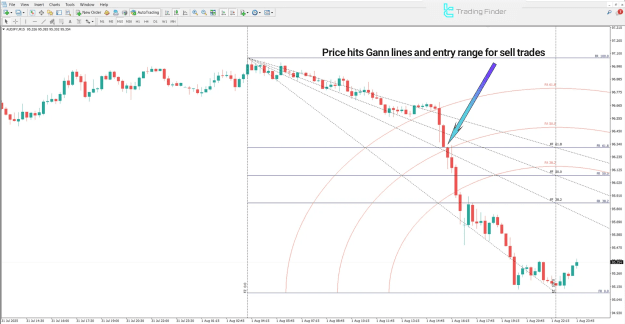
Applying the Indicator in a Downtrend
This analysis examines the AUD/JPY pair on a 15-minute timeframe. The indicator identifies bearish conditions through the following signals:
- Price Position: A decisive move below the 61.8% Fibonacci level signals a shift in control to sellers.
- Angle Breakdown: The breaking of lower Gann angles confirms increasing selling pressure.
- Signal Confluence: The likelihood of a continued price decline is significantly heightened if this downward movement coincides with a price peak near a sensitive time cycle or a bearish intersection with descending Gann fan lines. This confluence defines an optimal entry zone for sell trades.
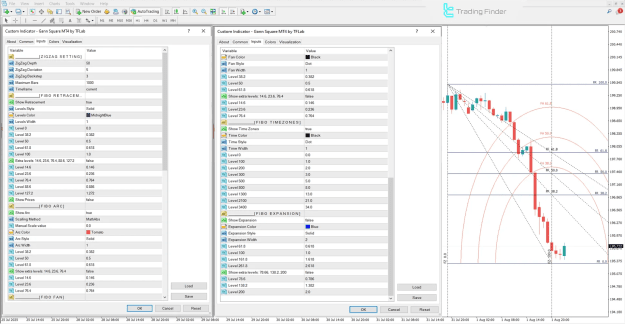
Configuring the Gann Square Indicator Settings
A detailed configuration is essential for optimizing the Gann Square Indicator. The settings panel in MetaTrader 4 is categorized for precise control:
ZigZag Settings
- ZigZag Depth: Adjusts the sensitivity to price swings and pivot points.
- ZigZag Deviation: Sets the minimum price change required to form a new ZigZag leg.
- ZigZag Backstep: Acts as a filter to prevent the identification of false pivot points.
- Maximum Bars: Defines the number of historical bars used in the calculation.
- Timeframe: Specifies the chart period for the analysis.
Fibonacci Retracement
- Show Retracement: Toggles the display of Fibonacci retracement levels.
- Level Style & Color: Controls the visual presentation of the retracement lines.
- Key Levels: Essential Fibonacci ratios are displayed, including the baseline (0%), the golden ratio zone (38.2%), the midpoint (50%), the key Fibonacci ratio (61.8%), and the full range (100%).
- Extra Levels: Allows for the display of additional ratios such as 14.6%, 23.6%, 76.4%, 88.6%, and 127.2% for more granular analysis.
Fibonacci Arc
- Show Arc: Activates the Fibonacci Arc tool.
- Scaling Method & Manual Scale Value: Determines how the arc is projected onto the chart.
- Arc Color, Style, and Width: Defines the visual properties of the arc.
- Levels: Projects key ratios like 38.2%, 50%, and 61.8% in a curved, time-based format.
Fibonacci Fan
- Fan Color, Style, and Width: Manages the appearance of the diagonal Fan lines.
- Levels: Draws dynamic support and resistance lines based on the 38.2%, 50%, and 61.8% ratios, among others.
Fibonacci Time Zones
- Show Time Zones: Enables the display of vertical time interval lines.
- Time Color, Style, and Width: Sets the visual properties of the time zone lines.
- Levels: Projects significant time cycles into the future based on Fibonacci sequences (0, 100, 200, 300, 500, 800, etc.).
Fibonacci Expansion
- Show Expansion: Toggles the price projection tool for setting profit targets.
- Expansion Color, Style, and Width: Controls the look of the expansion lines.
- Key Levels: Includes primary projection targets such as 61.8%, 100%, 161.8%, and 261.8%.
- Extra Levels: Permits the use of additional targets like 78.6%, 138.2%, and 200%.
Conclusion
The Gann Square Indicator stands as an advanced, multi-dimensional tool within technical analysis. By synthesizing market geometry, time cycles, and price behavior, it provides traders with a profound ability to identify reversal points, deconstruct trend structures, and locate sensitive price levels.
Its core components—Gann Angles, Gann Square, Gann Fan, and Time Arcs—are all unified by the fundamental principle of time-price symmetry. This indicator empowers market participants to evaluate conditions not solely on historical data but also with a computational and precise perspective, significantly aiding in the identification of optimal entry and exit zones.