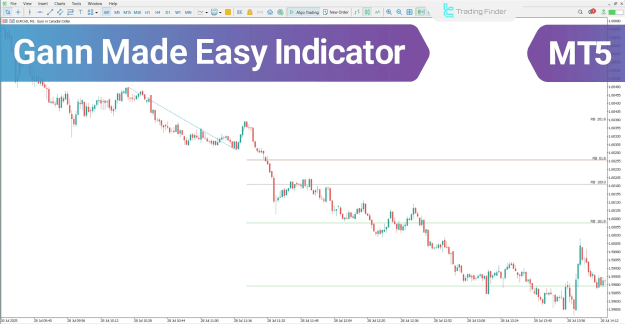
The Gann Made Easy Indicator is engineered to streamline the application of Gann theory in technical analysis. It automates the detection of crucial market levels directly on the trading chart. This tool calculates key zones for trade entry, profit targets, and stop-loss orders by integrating the foundational Gann principles of time and price. Furthermore, it provides clear visual trading signals through colored arrows as a setup materializes.
 You can download it from this link:
https://cdn.tradingfinder.com/file/5...5-by-tflab.zip
 You can also access the MetaTrader 4 version of this Indicator through this page:
https://www.metalsmine.com/thread/13...tatrader-4-mt4
 For instructions on how to install:
https://www.forexfactory.com/thread/...-in-metatrader
Prop Firm DrawDown Protector : Prop Firm Capital Protection Expert MT5 |Forex Money Management: Forex Trade Management Expert MT5 | ICT Concepts Indicator MT5 |Smart Money Concepts Expert MT5 | Smart Money Trap Scanner | Get a free Expert Advisor license via Telegram and WhatsApp
Gann Made Easy Indicator Overview
Automated Market Analysis and Signal Generation
The Gann Made Easy indicator begins by automatically analyzing market peaks and troughs to ascertain the prevailing trend direction. It then applies classic Gann angles, including 1:1 and 2:1, to compute significant price levels. These calculations result in the graphical presentation of entry zones, profit targets, and stop-loss areas on the chart. When the market structure aligns with its parameters, the indicator triggers an entry signal, represented by distinct colored arrows—green for buy and red for sell.
Trading Applications and Scenarios
Indicator in an Uptrend
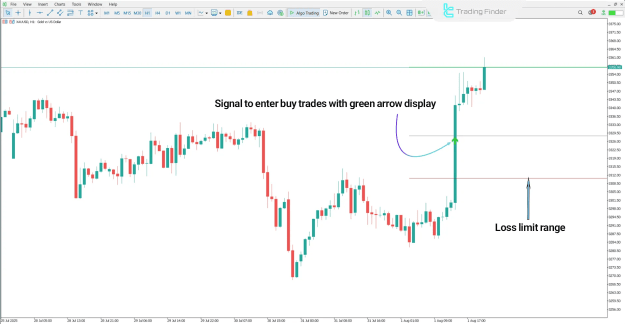
The following analysis features the Gold Spot (XAU/USD) on a 1-hour timeframe. During an uptrend, a buy signal is generated when the price breaches a resistance level, marked by a green arrow. The indicator strategically places the stop-loss just below the most recent swing low. Concurrently, profit targets are projected at higher price points, derived from the structure of Gann angles.
Indicator in a Downtrend
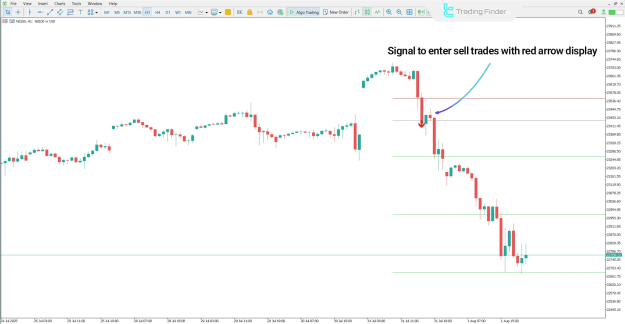
This examination uses the Nasdaq 100 (ND100) on a 1-hour chart. In a downtrend, a sell signal is initiated upon the price breaking below a support level, indicated by a red arrow. The stop-loss for this position is set slightly above the last significant price high to maintain controlled risk. The tool also delineates downward price targets below the entry point, clarifying the potential path for the trade and key areas for profit-taking.
Configurable Parameters
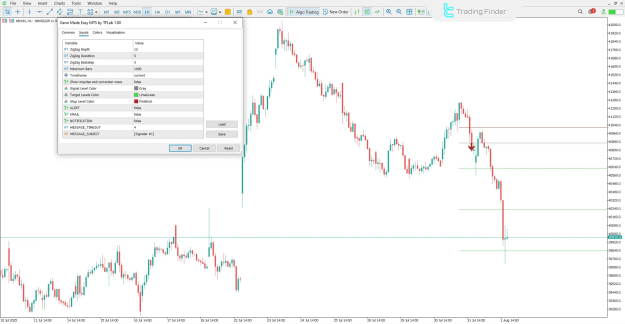
The Gann Made Easy indicator offers a range of adjustable settings to tailor its operation to individual trading preferences. Key configurable parameters include:
You can download it from this link:https://cdn.tradingfinder.com/file/5...5-by-tflab.zip
You can also access the MetaTrader 4 version of this Indicator through this page:https://www.metalsmine.com/thread/13...tatrader-4-mt4
For instructions on how to install:https://www.forexfactory.com/thread/...-in-metatrader
Inserted Video
Prop Firm DrawDown Protector : Prop Firm Capital Protection Expert MT5 |Forex Money Management: Forex Trade Management Expert MT5 | ICT Concepts Indicator MT5 |Smart Money Concepts Expert MT5 | Smart Money Trap Scanner | Get a free Expert Advisor license via Telegram and WhatsApp
Gann Made Easy Indicator Overview
Automated Market Analysis and Signal Generation
The Gann Made Easy indicator begins by automatically analyzing market peaks and troughs to ascertain the prevailing trend direction. It then applies classic Gann angles, including 1:1 and 2:1, to compute significant price levels. These calculations result in the graphical presentation of entry zones, profit targets, and stop-loss areas on the chart. When the market structure aligns with its parameters, the indicator triggers an entry signal, represented by distinct colored arrows—green for buy and red for sell.
Trading Applications and Scenarios
Indicator in an Uptrend
The following analysis features the Gold Spot (XAU/USD) on a 1-hour timeframe. During an uptrend, a buy signal is generated when the price breaches a resistance level, marked by a green arrow. The indicator strategically places the stop-loss just below the most recent swing low. Concurrently, profit targets are projected at higher price points, derived from the structure of Gann angles.
Indicator in a Downtrend
This examination uses the Nasdaq 100 (ND100) on a 1-hour chart. In a downtrend, a sell signal is initiated upon the price breaking below a support level, indicated by a red arrow. The stop-loss for this position is set slightly above the last significant price high to maintain controlled risk. The tool also delineates downward price targets below the entry point, clarifying the potential path for the trade and key areas for profit-taking.
Configurable Parameters
The Gann Made Easy indicator offers a range of adjustable settings to tailor its operation to individual trading preferences. Key configurable parameters include:
- ZigZag Depth
- ZigZag Deviation
- ZigZag Backstep
- Maximum Bars for calculation
- Preferred Timeframe
- Option to display impulse and correction waves
- Customization of colors for Signal, Target, and Stop Levels
- Alert options: Pop-up ALERT, EMAIL, and PUSH NOTIFICATION
- MESSAGE TIMEOUT to manage alert frequency
- MESSAGE SUBJECT for alert customization
Conclusion
The Gann Made Easy indicator efficiently automates the initial stages of market analysis by identifying significant highs and lows to determine trend direction and optimal entry zones. Subsequently, this advanced trading tool leverages Gann's analytical angles to automatically plot precise take-profit and stop-loss levels on the chart, providing a structured framework for trade management.
Attached Image(s) (click to enlarge)