Furthermore, the indicator incorporates a comprehensive visual panel that presents additional market data for each phase, offering deeper insight into overall market structure and price dynamics.
https://cdn.tradingfinder.com/file/5...4-by-tflab.zip
https://www.metalsmine.com/thread/13...r-metatrader-5
https://www.forexfactory.com/thread/...-in-metatrader
Prop Firm DrawDown Protector : Prop Firm Capital Protection Expert MT4 | Forex Money Management: Forex Trade Management Expert MT4 |ICT Concepts Indicator MT4 | Smart Money Concepts Expert MT4| Smart Money Trap Scanner | Get a free Expert Advisor license via Telegram and WhatsApp
Key Features and Specifications of the Quarterly Theory ICT 01 Indicator
The Quarterly Theory ICT 01 Indicator is one of the most sophisticated analytical systems developed for MetaTrader 4 (MT4). It integrates ICT (Inner Circle Trader) methodologies with advanced time-based market analysis, offering traders a precise tool for understanding market cycles and improving trade timing.
Key Attributes
- Indicator Categories: ICT MT4 Indicators, Smart Money MT4 Indicators, Trading Assist MT4 Indicators
- Platform Compatibility: MetaTrader 4
- Skill Level Required: Advanced
- Indicator Type: Reversal MT4 Indicator
- Supported Timeframes: Multi-Timeframe
- Trading Styles: Day Trading, Scalping, Swing Trading
- Applicable Markets: Forex, Stocks, and Cryptocurrency
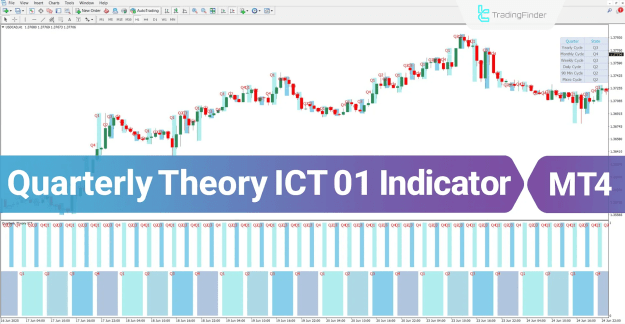
Structure and Concept of the ICT Quarterly Theory 01 Indicator
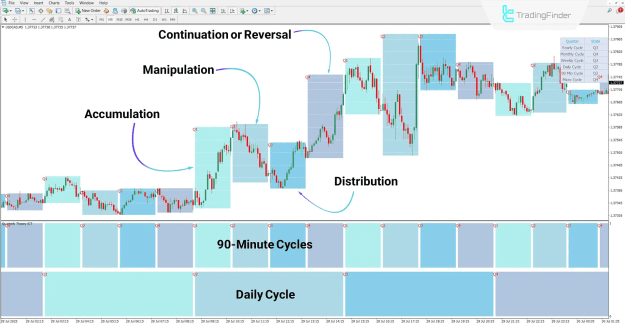
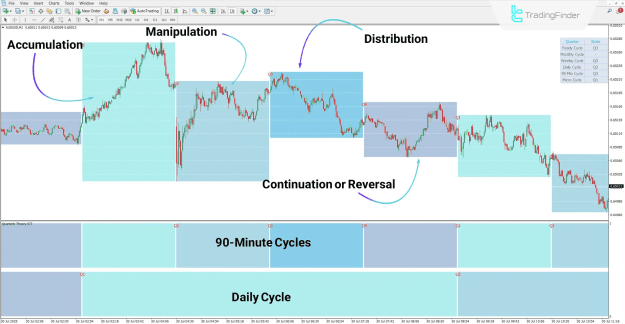
The ICT Quarterly Theory 01 Indicator divides any selected timeframe into four distinct quarters, each representing a different phase of the market cycle. This design reflects the natural rhythm and fractal behavior of price action, allowing traders to anticipate transitions between accumulation, manipulation, distribution, and continuation or reversal stages.
The Four Market Phases
- Q1 – Accumulation Phase:
The market consolidates within a range, building liquidity and preparing for a significant movement. - Q2 – Manipulation Phase:
This phase is marked by sudden volatility and liquidity grabs as the market begins to establish a new directional trend. - Q3 – Distribution Phase:
Price expands and distributes across a broader range, signaling trend maturity and profit-taking periods. - Q4 – Continuation or Reversal Phase:
The final stage where the market either sustains the prevailing trend or reverses direction to begin a new cycle.
Application in Bullish Trends
In a bullish market scenario, such as the USD/CAD pair on a 5-minute chart, the indicator visually segments price movement into quarterly cycles based on user-selected parameters. The typical sequence unfolds as follows:
- Accumulation Phase: Price consolidates at lower levels, forming a base.
- Manipulation Phase: Volatility increases as liquidity is taken out.
- Distribution Phase: The market expands upward with strong bullish momentum.
- Continuation Phase: The trend extends to higher price levels, confirming the direction.
This systematic visualization enables traders to recognize the rhythm of price movement and synchronize their entries with the dominant market phase.
Application in Bearish Trends
In a bearish setup, such as the AUD/USD pair on a 1-minute chart, the indicator plots a series of sequential quarters throughout the downtrend.
Each phase forms naturally as the market progresses, helping traders identify points of potential pullback or continuation within the declining trend.
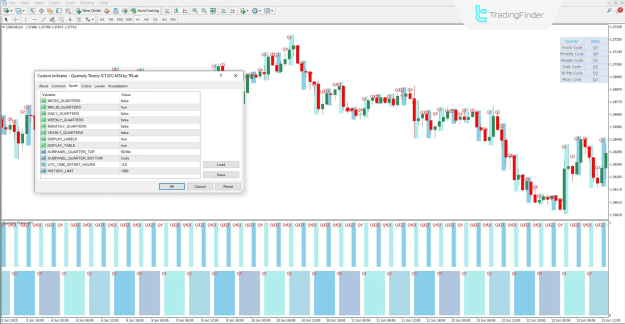
Adjustable Settings of the Quarterly Theory ICT 01 Indicator
The Quarterly Theory ICT 01 Indicator provides a variety of customizable parameters that allow traders to adapt it to different trading styles and timeframes:
- MICRO_QUARTERS: Toggle visibility of micro time cycles.
- MIN_90_QUARTERS: Enable 90-minute cycle analysis.
- DAILY_QUARTERS: Display daily quarter divisions.
- WEEKLY_QUARTERS: Visualize weekly market cycles.
- MONTHLY_QUARTERS: Activate monthly quarter segmentation.
- YEARLY_QUARTERS: Show yearly cycle structures for macro-level analysis.
- DISPLAY_LABELS: Show or hide Q1–Q4 labels directly on the chart.
- DISPLAY_TABLE: Toggle the time-phase summary panel on the right side of the chart.
- SUBPANEL_QUARTER_TOP / BOTTOM: Manage higher and lower timeframe cycles in subpanels.
- UTC_TIME_OFFSET_HOURS: Adjust the indicator to match the trader’s local timezone.
- HISTORY_LIMIT: Set the number of historical candles used in calculations.
Conclusion
The Quarterly Theory ICT 01 Indicator offers a structured and data-driven approach to understanding market behavior by dividing time into four recurring phases—Accumulation, Manipulation, Distribution, and Continuation/Reversal.
By applying this cyclical model to multiple timeframes—from 90-minute intervals up to yearly charts—traders can enhance the accuracy of their entry and exit strategies.
The inclusion of a visual data panel further strengthens decision-making by presenting essential information about current and upcoming market phases, making this indicator an indispensable tool for advanced ICT-based trading strategies in Forex, stock, and cryptocurrency markets.