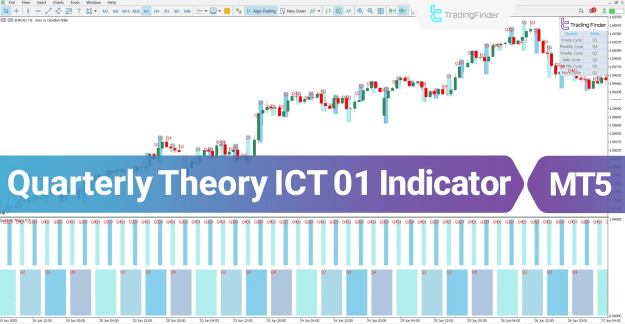
By precisely segmenting time periods into four consecutive phases—Q1, Q2, Q3, and Q4—this indicator significantly aids in the identification of optimal market entry and exit points for traders. Furthermore, it includes a graphical table that provides users with a clear, concise overview of various time cycles.
https://cdn.tradingfinder.com/file/5...5-by-tflab.zip
https://www.metalsmine.com/thread/13...r-for-mt4-free
https://www.forexfactory.com/thread/...-in-metatrader
Prop Firm DrawDown Protector : Prop Firm Capital Protection Expert MT5 |Forex Money Management: Forex Trade Management Expert MT5 | ICT Concepts Indicator MT5 |Smart Money Concepts Expert MT5 | Smart Money Trap Scanner | Get a free Expert Advisor license via Telegram and WhatsApp
Specifications and Capabilities
This sophisticated indicator is designed for Advanced trading skill levels and operates across multiple timeframes (Multi-Timeframe MT5 Indicators).
Platforms: MetaTrader 5 (MT5 Indicators).
Indicator Types: Reversal MT5 Indicators.
Trading Styles: Suitable for Swing Trading MT5 Indicators, Scalper MT5 Indicators, and Day Trading MT5 Indicators.
Trading Instruments: Applicable across Forex MT5 Indicators, Crypto MT5 Indicators, and Stock MT5 Indicators.
Quarterly Theory ICT 01 Indicator at a Glance: The Four Quarters
The core function of the Quarterly Theory ICT 01 Indicator involves dividing each selected timeframe into four equal parts, which are referred to as "Quarters." Each of these quarters represents a distinct stage in typical market behavior:
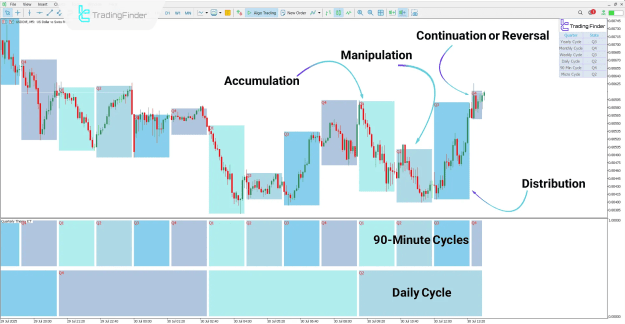
- Q1: Accumulation Phase – Characterized by market consolidation and preparation for the subsequent price move.
- Q2: Manipulation Phase – Marks the start of the real trend often with sudden volatility as liquidity is absorbed via a deceptive move (e.g., a liquidity grab).
- Q3: Distribution Phase – The stage of wide distribution of price, typically seeing significant movement aligned with the newly established trend.
- Q4: Continuation or Reversal Phase – The final phase, where the market either returns to the previous trend direction or continues the current trend.
Applying the Indicator in Trend Analysis
The indicator provides powerful visual and analytical insights into market cycles, as demonstrated in both bullish and bearish scenarios.
Bullish Trend Analysis with the Quarterly Theory ICT 01 Indicator
In a bullish trend example, such as the USD/CHF chart on the 5-minute timeframe:
- The price movement begins in the Accumulation Phase (Q1).
- Liquidity is then absorbed through a deceptive maneuver in the Manipulation Phase (Q2).
- Following the manipulation, the price enters the Distribution Phase (Q3), which facilitates significant upward growth.
The indicator is thus crucial for identifying buy trade setups by segmenting the market structure.
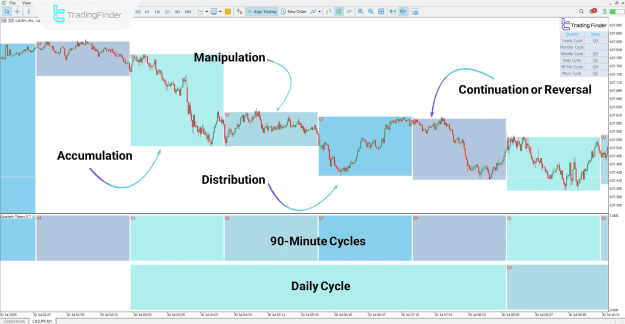
Bearish Trend Review with the Quarterly Theory ICT 01 Indicator
The indicator's effectiveness in a bearish market trend is visible, for instance, on the CAD/JPY 1-minute chart:
- The four consecutive cycles appear sequentially, with the price action reacting consistently with the characteristics of each phase.
This functionality is vital for identifying the main directional flow of the trend and potential short-selling opportunities.
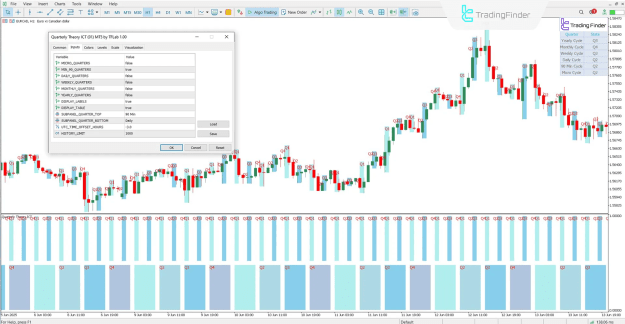
Quarterly Theory ICT 01 Indicator Settings and Customization
The Quarterly Theory ICT 01 Indicator is highly customizable, allowing traders to adapt it to their specific trading strategies and preferred time horizons. Key settings include:
Cycle Visibility
Users can activate or display various time cycles, ranging from short-term to long-term:
- MICRO_QUARTERS: Micro cycles visibility.
- MIN_90_QUARTERS: 90-minute cycles activation.
- DAILY_QUARTERS: Daily cycles activation.
- WEEKLY_QUARTERS: Weekly cycles visibility.
- MONTHLY_QUARTERS: Monthly cycles visibility.
- YEARLY_QUARTERS: Yearly cycles display.
Display Options
For enhanced clarity and visualization:
- DISPLAY_LABELS: Shows Q1–Q4 phase labels directly on the chart.
- DISPLAY_TABLE: Activates the time phase table in the right panel.
- SUBPANEL_QUARTER_TOP and SUBPANEL_QUARTER_BOTTOM: Selects the upper and lower cycle timeframes for display in a subpanel below the chart.
Technical Adjustments
- UTC_TIME_OFFSET_HOURS: Allows for adjustment of the time difference from UTC.
- HISTORY_LIMIT: Sets the limit of past candles used for indicator calculations.
Conclusion
The Quarterly Theory ICT 01 Indicator offers traders a structured and analytical framework for understanding price behavior by dividing time into the four consecutive phases: Accumulation, Manipulation, Distribution, and Continuation or Reversal. This powerful trading tool is applicable across a wide range of timeframes (from 90 minutes to long-term cycles like monthly and yearly) and is highly effective at facilitating the precise identification of market entry and exit points based on recognized Smart Money concepts.