https://cdn.tradingfinder.com/file/4...-mt4-tflab.zip
https://www.metalsmine.com/thread/13...-indicatorsmt5
https://www.forexfactory.com/thread/...-in-metatrader
Prop Firm DrawDown Protector : Prop Firm Capital Protection Expert MT4 | Forex Money Management: Forex Trade Management Expert MT4 |ICT Concepts Indicator MT4 | Smart Money Concepts Expert MT4| Smart Money Trap Scanner | Get a free Expert Advisor license via Telegram and WhatsApp
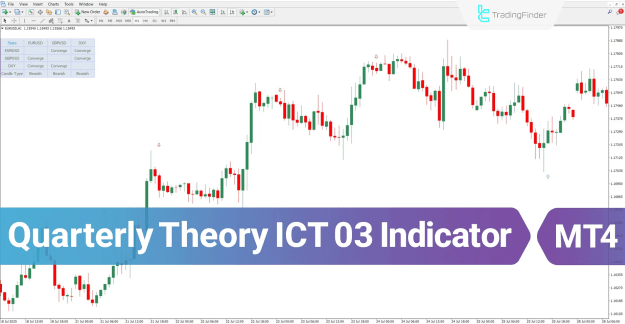
How the Indicator Works
This advanced indicator detects emerging strength or weakness in prevailing market trends by analyzing convergence and divergence patterns in candle closings across multiple trading symbols. The system visually marks these significant patterns with colored arrows, providing clear, actionable signals to traders.
Key Features:
- Real-time divergence/convergence monitoring between correlated assets
- Multi-symbol analysis capability
- Comprehensive live data table display
- Advanced pattern recognition technology
Indicator Specifications Overview
Compatibility and Categories:
- Platform: MetaTrader 4
- Skill Level: Advanced Trading
- Indicator Type: Reversal Detection
- Timeframe: Multi-Timeframe Analysis
- Trading Styles Supported:
- Day Trading
- Scalping
- Swing Trading
- Market Applications:
- Forex Markets
- Cryptocurrency Trading
- Stock Market Analysis
Understanding Precision Swing Points
The core of the ICT 03 Indicator revolves around the Precision Swing Points pattern structure, which consists of three distinct candles with specific characteristics:
Pattern Significance
The middle candle within the three-candle formation carries the highest importance for signal generation. The relationship between this candle across different symbols determines the nature of the divergence and subsequent trading signal.
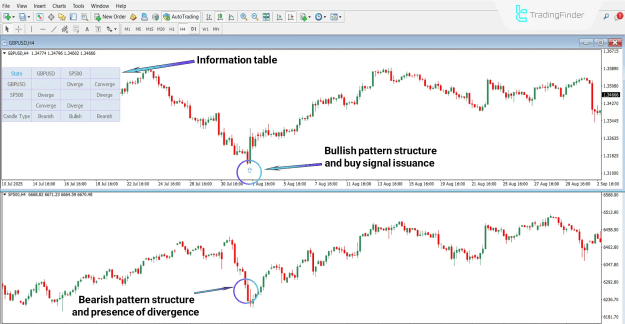
Bullish Signal Formation
When the middle candle demonstrates a bearish character in the base symbol while simultaneously showing a bullish character in the correlated symbol, the indicator identifies a positive divergence. This configuration triggers a definitive buy signal.
Practical Example:
- Base Symbol: GBP/USD
- Correlated Symbol: SP500
- Pattern: Bullish formation in base currency, bearish pattern in correlated symbol
- Result: Buy signal generated on GBP/USD chart
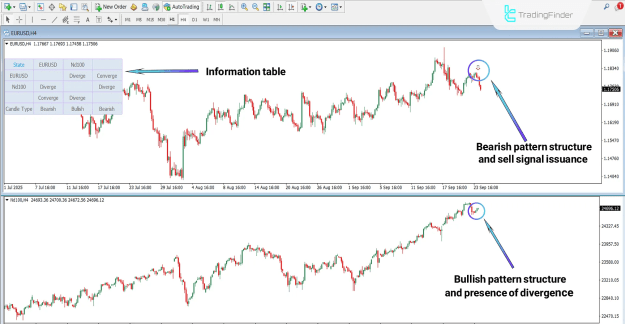
Bearish Signal Formation
Conversely, when the middle candle displays a bullish character in the base symbol alongside a bearish character in the correlated symbol, the system detects a negative divergence. This pattern results in a sell signal being issued.
Practical Example:
- Base Symbol: EUR/USD
- Correlated Symbol: Nd100
- Pattern: Bearish pivot formation in base currency, bullish pattern in correlated symbol
- Result: Sell signal generated on EUR/USD chart
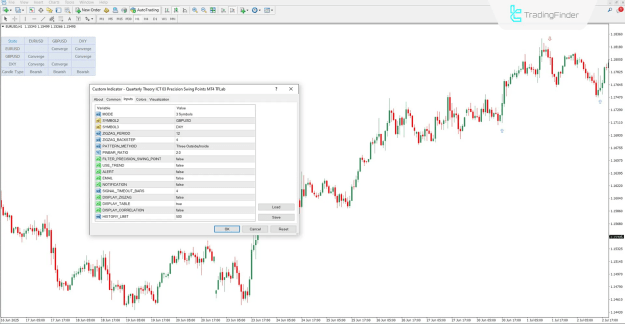
Comprehensive Settings Configuration
The ICT 03 Indicator offers extensive customization options through its settings panel:
Core Configuration Parameters
MODE Selection
- Choose between two or three symbol comparison modes
Symbol Configuration
- SYMBOL2: Designate secondary symbol for analysis
- SYMBOL3: Designate tertiary symbol (when using three-symbol mode)
ZigZag Parameters
- ZIGZAG_PERIOD: Set calculation period for ZigZag line analysis
- ZIGZAG_BACKSTEP: Define minimum candle separation between swing points
Pattern Recognition Settings
- PATTERN_METHOD: Determine candlestick pattern structure parameters
- PINBAR_RATIO: Establish validation threshold for pin bar formations
Advanced Filtering Options
- FILTER_PRECISION_SWING_POINT: Enable precision pattern filtering
- USE_TREND: Apply trend direction filters for signal relevance
Alert and Notification Systems
- ALERT: Enable audio/visual alert notifications
- EMAIL: Configure email-based signal delivery
- NOTIFICATION: Activate push notification capabilities
Display and Historical Settings
- SIGNAL_TIMEOUT_BARS: Set signal persistence duration on charts
- DISPLAY_ZIGZAG: Toggle ZigZag structure visibility
- DISPLAY_TABLE: Control divergence/candle status table display
- DISPLAY_CORRELATION: Show correlation metrics between symbols
- HISTORY_LIMIT: Define historical candle analysis depth
Professional Application and Strategic Implementation
The Quarterly Theory ICT 03 Indicator stands as a professional-grade tool specifically engineered to identify precise market turning points through sophisticated divergence analysis across correlated assets.
Signal Generation Methodology
The system generates trading signals on the fourth candle following the completion of the three-candle Precision Swing Points formation. This structured approach ensures confirmation of pattern validity before signal execution.
Real-Time Analytical Capabilities
The integrated live table provides continuous monitoring of divergence status, candlestick pattern types, and correlation dynamics between selected symbols, offering traders comprehensive market intelligence at a glance.
This advanced indicator represents a significant advancement in technical analysis tools, providing traders with enhanced capabilities for identifying high-probability trading opportunities through multi-asset correlation analysis and precision pattern recognition.
Conclusion
In summary, the Quarterly Theory ICT 03 Indicator is a sophisticated tool that empowers traders to identify high-probability market turning points. By analyzing precision swing points and detecting divergences between correlated assets, it provides clear, actionable signals for making informed trading decisions. This makes it an invaluable professional-grade addition to any advanced trading strategy on MetaTrader 4.