Designed for professional traders, it identifies divergence patterns and potential market turning points by monitoring the relationship between two or three correlated assets in real time.
At its core, this indicator applies the Precision Swing Points method to reveal hidden price imbalances and generate buy or sell signals with high accuracy.
https://cdn.tradingfinder.com/file/4...-mt5-tflab.zip
https://www.metalsmine.com/thread/13...-indicatorsmt5
https://www.forexfactory.com/thread/...-in-metatrader
Prop Firm DrawDown Protector : Prop Firm Capital Protection Expert MT5 |Forex Money Management: Forex Trade Management Expert MT5 | ICT Concepts Indicator MT5 |Smart Money Concepts Expert MT5 | Smart Money Trap Scanner | Get a free Expert Advisor license via Telegram and WhatsApp
Standout Features
- Correlated Market Detection – Evaluates price action between two or three instruments to uncover bullish or bearish divergences.
- Precision Swing Points Pattern – Uses a three-candle setup to spot momentum shifts before the market reverses.
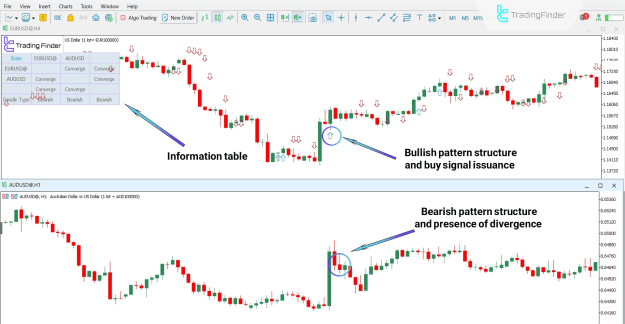
- Dynamic Divergence Table – Shows live candle direction, correlation strength, and divergence status directly on the chart.
- Advanced Customization – Allows traders to fine-tune every parameter to match their strategy and preferred trading style.
Trading Methodology
The Quarterly Theory ICT 03 relies on a three-candle pattern, with the middle candle providing the key signal. It compares the candle closes of the main symbol against one or two correlated assets to identify market strength or weakness:
- Bullish Divergence (Buy Signal)
- The middle candle on the main symbol closes bearishly,
- While the correlated symbol closes bullishly.
- This positive mismatch signals underlying buying pressure, triggering a buy alert on the next candle.
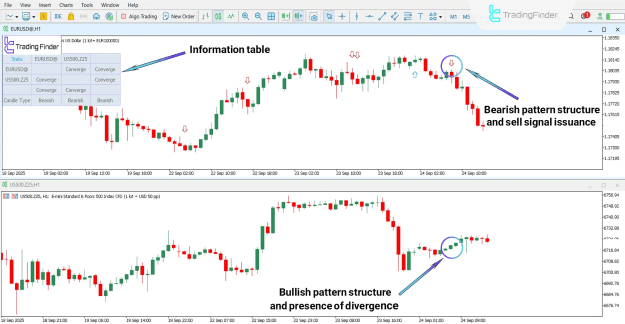
- Bearish Divergence (Sell Signal)
- The middle candle on the main symbol closes bullishly,
- While the correlated symbol closes bearishly.
- This negative divergence reveals weakening momentum, prompting a sell alert.
Signals are issued on the fourth candle, immediately after the three-candle pattern is confirmed.
Trading Methodology
The Quarterly Theory ICT 03 relies on a three-candle pattern, with the middle candle providing the key signal. It compares the candle closes of the main symbol against one or two correlated assets to identify market strength or weakness:
- Bullish Divergence (Buy Signal)
- The middle candle on the main symbol closes bearishly,
- While the correlated symbol closes bullishly.
- This positive mismatch signals underlying buying pressure, triggering a buy alert on the next candle.
- Bearish Divergence (Sell Signal)
- The middle candle on the main symbol closes bullishly,
- While the correlated symbol closes bearishly.
- This negative divergence reveals weakening momentum, prompting a sell alert.
Signals are issued on the fourth candle, immediately after the three-candle pattern is confirmed.
Real-World Examples
- Positive Divergence:
If EUR/USD prints a bearish middle candle while AUD/USD closes bullishly, the indicator flags a buy opportunity on EUR/USD. - Negative Divergence:
When EUR/USD forms a bullish middle candle but US500 closes bearish, the tool identifies a sell setup based on hidden weakness.
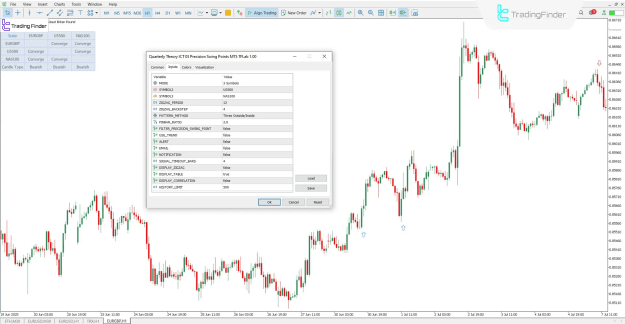
Customizable Inputs
The indicator includes a wide range of settings for complete control:
- MODE – Select two-symbol or three-symbol comparison.
- SYMBOL2 / SYMBOL3 – Define correlated assets for divergence tracking.
- ZIGZAG_PERIOD / ZIGZAG_BACKSTEP – Adjust swing point sensitivity.
- PATTERN_METHOD / PINBAR_RATIO – Set rules for valid candle formations.
- FILTER_PRECISION_SWING_POINT – Display only the most precise patterns.
- USE_TREND – Filter signals in the direction of the main trend.
- ALERT / EMAIL / NOTIFICATION – Enable on-screen alerts, emails, or push notifications.
- DISPLAY_TABLE / DISPLAY_CORRELATION – Show or hide the live divergence and correlation table.
- HISTORY_LIMIT – Control how many historical candles are analyzed.
Why This Indicator Stands Out
The Quarterly Theory ICT 03 Indicator gives traders a competitive advantage by exposing market signals that standard technical tools often miss.
Its integration of ICT methodology, multi-symbol correlation analysis, and Precision Swing Points makes it ideal for capturing early reversal setups in Forex, cryptocurrencies, and stocks.
Whether used for short-term scalping or long-term swing trading, this indicator provides clear, actionable signals to navigate volatile markets with confidence.
Conclusion
The Quarterly Theory ICT 03 Indicator is an advanced tool for spotting reversals and divergences across multiple markets.
Using ICT methodology and the Precision Swing Points pattern, it identifies high-probability buy and sell signals with real-time visual feedback.
Ideal for Forex, crypto, and stock traders, this indicator enhances decision-making and helps capture critical market turning points with precision and confidence.