Prop Firm DrawDown Protector : Prop Firm Capital Protection Expert MT4 | Forex Money Management: Forex Trade Management Expert MT4 |ICT Concepts Indicator MT4 | Smart Money Concepts Expert MT4| Smart Money Trap Scanner | Get a free Expert Advisor license via Telegram and WhatsApp
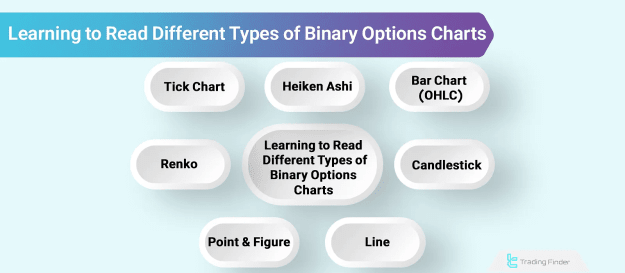
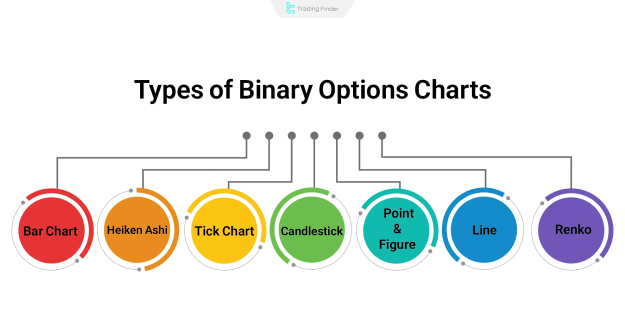
Types of Binary Options Charts
In binary options, the selection of price charts is crucial for effective technical analysis. Charts like candlestick, Heiken Ashi, and Renko each offer distinct perspectives on price action and market trends.
- OHLC / Bar Chart
- Candlestick Charts
- Line Charts
- Heiken Ashi
- Renko Chart
- Point & Figure
- Tick Chart
Bar Chart (OHLC / Bar Chart)
In this chart format, each bar illustrates four essential data points: Open, High, Low, and Close.
The vertical line depicts the price range, with short horizontal lines on the left and right indicating the opening and closing prices, respectively.
Components of a Bar Chart:
- Vertical line: Represents the span between the highest and lowest prices within the timeframe.
- Small horizontal line on the left: Indicates the opening price at the beginning of the timeframe.
- Small horizontal line on the right: Shows the closing price at the end of the timeframe.
Application of Bar Charts in Binary Options Trading
Bar charts function as a tool to filter out weak or false breakouts. Key applications in binary options trading include:
- Examining real-time price movements closely, particularly for short expiry periods (60 seconds to 2 minutes).
- Detecting breakouts in resistance or support areas by evaluating the bar's closing position relative to its high and low.
- Integrating with supplementary indicators, such as EMA 50 or EMA 200, to validate trend strength prior to entry.
Advantages and Disadvantages of Using Bar Charts in Binary Options
Advantages:
- Precise representation of four primary market data points.
- Capability to pinpoint breakouts and supply/demand zones.
- Effective for assessing market structure.
Disadvantages:
- More challenging for novice traders.
- Reduced emphasis on market sentiment compared to candlesticks.
- Less prevalent on binary trading platforms.
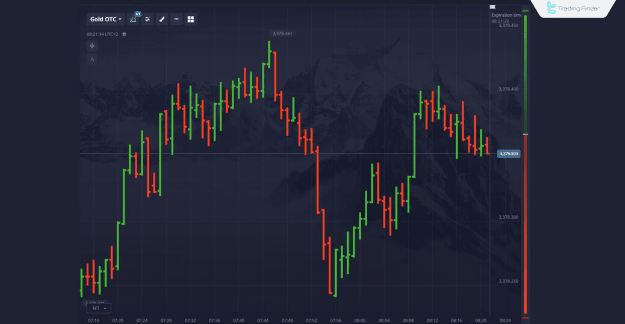
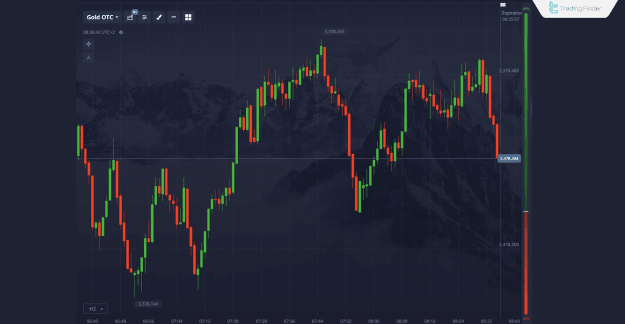
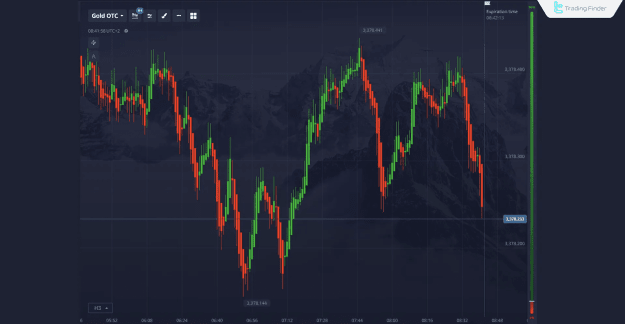
Candlestick Charts
Candlestick charts are the most prevalent and versatile type. Each candlestick features a body (the gap between Open and Close) and shadows.
The body's color signifies the price direction. This format captures market psychology and is ideal for price action analysis.
Professional Application of Candlestick Charts in Binary Options Trading
Candlestick charts form the basis of numerous price action strategies. Professional uses in binary options include:
- Spotting candlestick patterns on M1 and M5 timeframes for accurate entries in turbo trades.
- Implementing reversal strategies using patterns like Pin Bar, Engulfing, and Doji at critical levels.
- Verifying signals with indicators such as RSI or Stochastic on the same low-timeframe candles.
Advantages and Disadvantages of Using Candlestick Charts in Binary Options
Advantages:
- Excellent readability and clear depiction of market sentiment.
- Facilitates identification of candlestick patterns.
- Optimal for integration with price action strategies.
Disadvantages:
- Generates noise in smaller timeframes.
- Demands experience for reliable interpretation.
- Highly responsive to the selected timeframe.
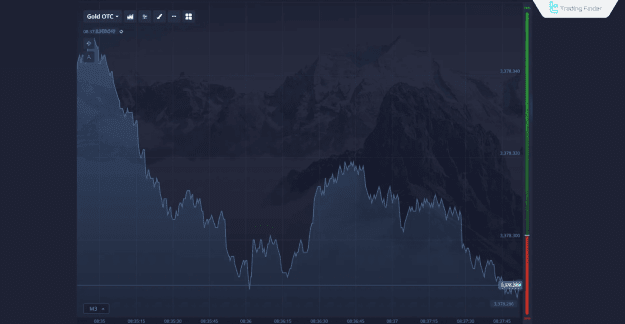
Line Charts
Line charts connect closing prices across timeframes with a continuous line, highlighting the overall trend while eliminating distractions from minor price variations.
Application of Line Charts in Binary Options Trading
Line charts offer a broad overview of trends. Additional applications in binary options trading encompass:
- Quickly assessing general direction on higher timeframes like M15 or M30 before initiating 1- to 5-minute trades.
- Analyzing trend shifts post-economic news without interference from candlestick shadows.
- Identifying zones for trend continuation to place Call or Put trades aligned with the dominant direction.
Advantages and Disadvantages of Using Line Charts in Binary Options
Advantages:
- Simplicity and efficiency in analysis.
- Eliminates minor noise.
- Ideal for evaluating overall trend direction.
Disadvantages:
- Omits Open, High, and Low prices.
- Unsuitable for detailed price action.
- Limited in pinpointing exact entry and exit points.
Heiken Ashi
Heiken Ashi represents a modified candlestick chart, constructed by averaging price data to present smoother trends devoid of noise, simplifying trend detection.
Application of Heiken Ashi Charts in Binary Options Trading
Heiken Ashi charts emphasize robust market trends and eliminate noise. Applications in binary options trading include:
- Employing in trend-following strategies to enter positions aligned with the prevailing trend.
- Avoiding erroneous entries during brief corrective periods.
- Appropriate for trades with extended expiry durations (10 minutes to 1 hour).
- Pairing with Bollinger Bands or EMA to affirm trend persistence.
Advantages and Disadvantages of Using Heiken Ashi in Binary Options
Advantages:
- Eliminates noise and displays consistent trends.
- Beneficial for recognizing long-term trends.
- Filters out false signals.
Disadvantages:
- Exhibits lag relative to actual prices.
- Diminishes precision in rapid trades.
- Requires pairing with primary charts for accurate entries.
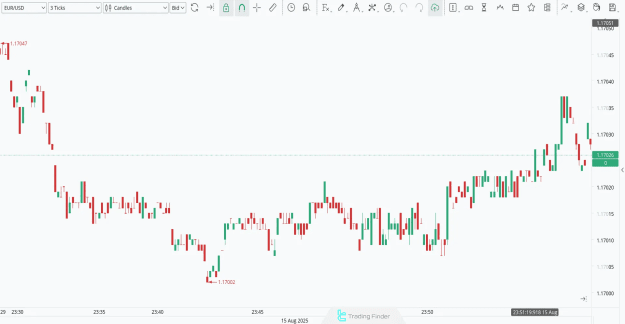
Tick Chart
A Tick Chart constructs data based on the volume of trades (ticks) rather than time intervals. Each tick or candle forms after a predetermined number of trades.
Application of Tick Charts in Binary Options Trading
Tick charts deliver a precise view of price shifts prior to the completion of a one-minute candle. Professional applications in binary options include:
- Ideal for scalping on high-volume pairs like EUR/USD during London or New York sessions.
- Utilized in high-frequency trades with expiries under 30 seconds.
- Combined with indicators like Parabolic SAR for swift entries.
Advantages and Disadvantages of Using Tick Charts in Binary Options
Advantages:
- Reveals exact real-time fluctuations.
- Suited for scalping in high-volume environments.
- Clarifies authentic market movements.
Disadvantages:
- Demands a fast and reliable internet connection.
- Less effective in low-volume markets.
- Challenging for managing expiry times in binary trading.
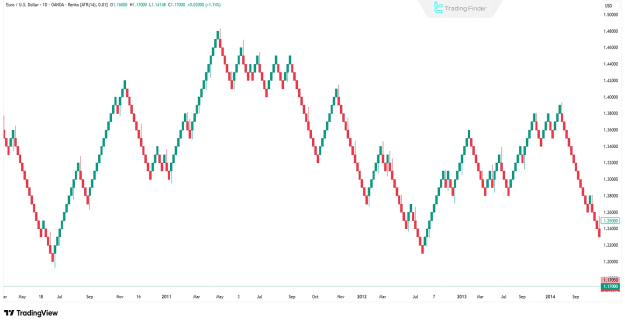
Renko Chart
Renko Charts are formed based on price movements independent of time, displaying only substantial shifts to filter noise and enhance trend clarity.
Application of Renko Charts in Binary Options Trading
Renko charts concentrate on price dynamics in stable trends irrespective of time. Other uses include:
- Filtering insignificant movements to focus on major price changes.
- Integrating with the ATR indicator to adjust brick sizes according to volatility.
- Identifying significant reversal points without timeframe interference.
Advantages and Disadvantages of Using Renko Charts in Binary Options
Advantages:
- Filters minor movements, emphasizing trends.
- Provides clearer trend identification.
- Appropriate for continuation trades.
Disadvantages:
- Delays in reflecting abrupt reversals.
- Does not indicate precise timing of movements.
- Less ideal for scalping signals.
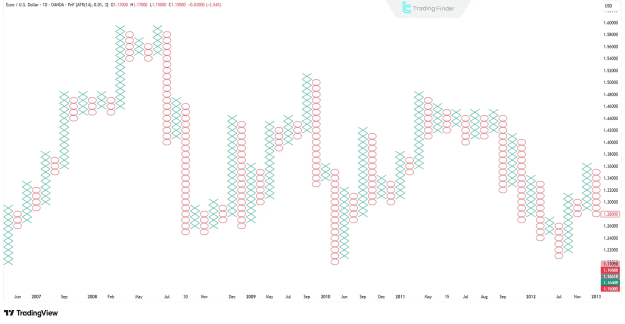
Point & Figure
Point & Figure charting focuses on price fluctuations without regard to time, using X for rises and O for falls to identify trends, support/resistance, and entry/exit opportunities.
Application of Point and Figure Charts in Binary Options
Traders leverage Point and Figure charts to detect robust support and resistance zones before trades. Applications include:
- Distinguishing false from valid breakouts in candlestick or bar charts.
- Suitable for price structure-focused traders over time-based analysis.
- Combining with volume indicators to validate breakouts.
Advantages and Disadvantages of Using Point & Figure in Binary Options
Advantages:
- Eliminates time-related noise, concentrating on price direction.
- Efficient for locating key levels.
- Detects genuine breakouts.
Disadvantages:
- Complicated for beginners.
- Infrequently available on binary platforms.
- Necessitates adjustments to unit sizes.
How to Read Binary Options Charts?
Chart interpretation in binary options underpins trader decisions. Success arises from analyzing price within trend, level, and timing frameworks.
To optimize chart usage in binary options, adhere to these steps:
#1 Identify Market Structure
Determine market direction by examining highs, lows, and key zones. Higher highs signal uptrends, lower highs indicate downtrends, and horizontal ranges denote consolidation.
Align trading decisions with this structure.
#2 Recognize Key Levels
Identify support/resistance zones, supply/demand areas, and daily highs/lows as critical reaction points.
Entries at these levels enhance risk-to-reward ratios and prevent impulsive trades in mid-range areas.
#3 Select Chart Type Matching Your Strategy
For accurate strategy execution, choose the appropriate chart:
- Candlestick charts for price action analysis.
- Heiken Ashi for trend clarification.
- Renko for noise reduction.
- Line charts for rapid support/resistance drawing.
#4 Analyze Candles and Chart Components
In candlestick patterns, bodies reflect momentum, while extended wicks signify level rejections.
Patterns such as Pin Bar or Engulfing hold validity only at key zones. Candlestick analysis defines precise entry timing.
#5 Use Indicators
Supplement price action with indicators like RSI for divergence, Bollinger Bands for ranges and breakouts, and Moving Averages for trend direction and pullbacks.
#6 Select Expiry Time
Set expiry to 1-2 times the signal timeframe. For M1, 60-120 seconds is typical; for M5, 5-10 minutes is advised. Proper expiry allows full price movement completion.
Choosing the Right Expiry Time for Binary Options:
Practical Note:
- Do not enter during the last 20 seconds of the candle: 60–120 seconds expiry for M1 timeframe.
- Better for divergence setups: 90–180 seconds expiry for M2–M3 timeframes.
- Only when M15 aligns: 5–10 minutes expiry for M5 timeframe.
Sources of Binary Options Charts
Traders access binary options charts through two primary sources:
- Downloadable Charts: Software-based, providing extensive customization, historical data storage, and advanced indicators.
- Online Charts: Browser-based or broker-embedded, accessible without downloads.
Downloadable Charts
These are desktop-installed tools for in-depth analysis:
- MetaTrader 4 (MT4): Widely adopted for Forex and binary options, supporting indicators and expert advisors.
- MetaTrader 5 (MT5): Enhanced version of MT4 with additional tools and timeframes.
- MultiCharts: Geared toward professionals with multiple data sources.
- NinjaTrader: Advanced software for technical analysis and strategy implementation.
Online Charts
These operate directly in browsers without installation:
- TradingView: Customizable online tool with indicators and scripts.
- My FX Dashboard (by OFX): Free resource for exchange rates and charts.
- Investing.com Charts: Real-time charts for Forex, stocks, indices, and cryptocurrencies.
- CoinMarketCap & CoinGecko Charts: Tailored for cryptocurrency prices and token visuals.
Conclusion
In binary options trading, proficiency in reading binary options charts directly impacts outcomes, as each chart delivers specific price insights.
For instance, candlestick charts are vital for price action and psychology, while bar charts aid in breakout detection.
To effectively interpret binary options charts, traders should follow a systematic approach: identify structure, pinpoint key levels, select suitable charts, analyze components, and determine appropriate expiries.