Prop Firm DrawDown Protector : Prop Firm Capital Protection Expert MT5 | Forex Money Management: Forex Trade Management Expert MT4 | ICT Concepts Indicator MT5 |Smart Money Concepts Expert MT5 |Get a free Expert Advisor license via Telegram and WhatsApp
What Are Forex Indicators?
Forex indicators are computational models that interpret price and volume data, presenting it as charts, lines, or shaded areas on a trading platform. They are a core component of technical analysis, enabling traders to identify potential market shifts and patterns.
Main Categories of Forex Indicators
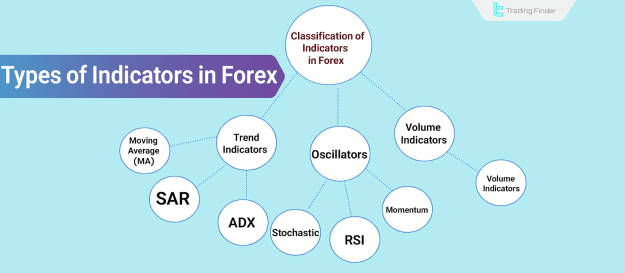
Technical indicators are broadly classified into three primary groups, each serving a distinct analytical purpose:
- Trend Indicators
- Oscillators
- Volume Indicators
Trend Indicators
Trend indicators are designed to identify and define the prevailing direction of price movements over a specific period. They use historical data to highlight whether the market is in a bullish, bearish, or sideways phase.
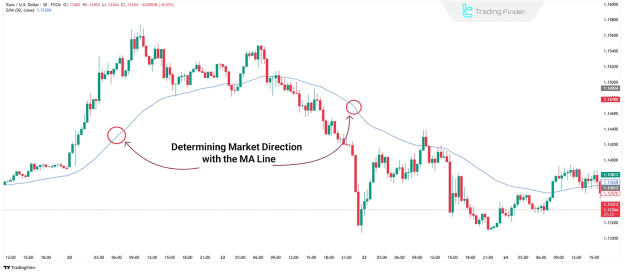
- Moving Averages (MA): The MA is a foundational tool that smooths out price data to reveal the overall market direction. Traders commonly use crossovers of two different MAs (e.g., a 50-period and a 200-period) to generate trading signals.
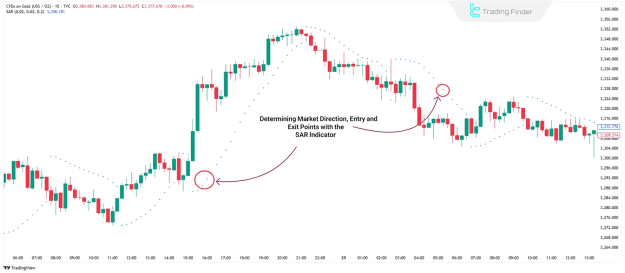
- Parabolic SAR: This indicator appears as a series of dots. Dots below the price signal an uptrend, while dots above the price signal a downtrend. It's an excellent tool for identifying potential entry and exit points and managing stop-loss levels.
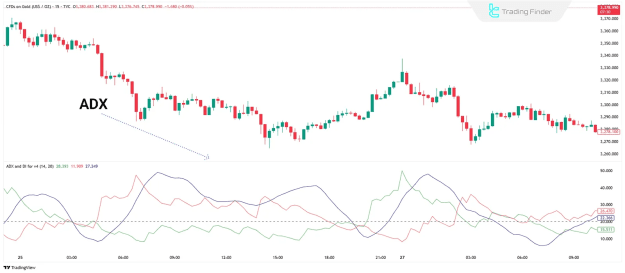
- Average Directional Index (ADX): The ADX measures the strength of a trend. A rising ADX value suggests the current trend is gaining momentum, while a falling value indicates a weakening or ranging market.
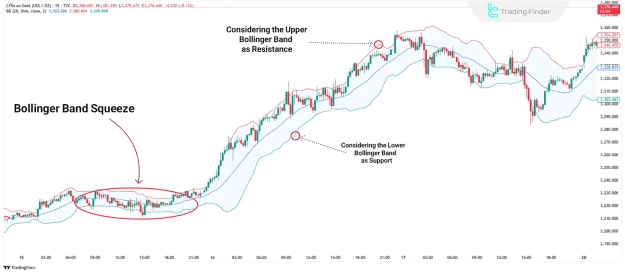
- Bollinger Bands: These bands consist of a moving average and two standard deviation lines, which expand and contract with market volatility. They are useful for identifying periods of low volatility (band tightening) that often precede a significant price move, as well as dynamic support and resistance levels.
Oscillators
Oscillators are tools that measure price momentum and help identify overbought and oversold conditions. They fluctuate between two fixed limits, providing insights into the market's strength.
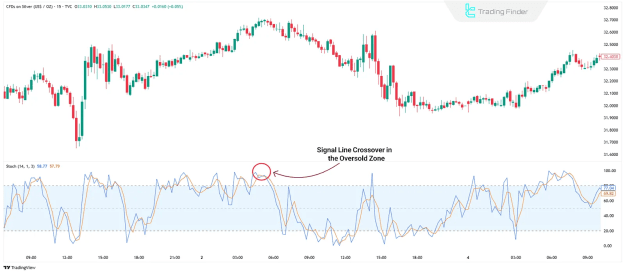
- Stochastic Oscillator: This indicator uses two lines (%K and %D) to identify potential reversals. Readings above 80 suggest an asset is overbought, while readings below 20 signal it is oversold.
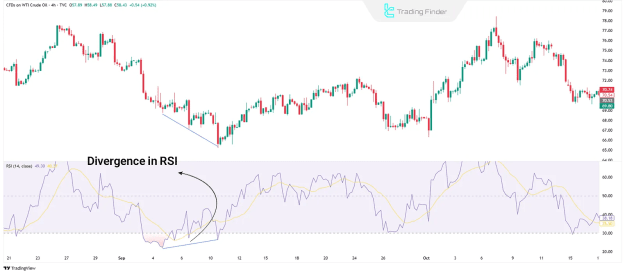
- Relative Strength Index (RSI): The RSI compares upward and downward price changes to assess a trend's strength. A key use of the RSI is to spot divergence, where the indicator's movement contradicts the price action, often foreshadowing a trend reversal.
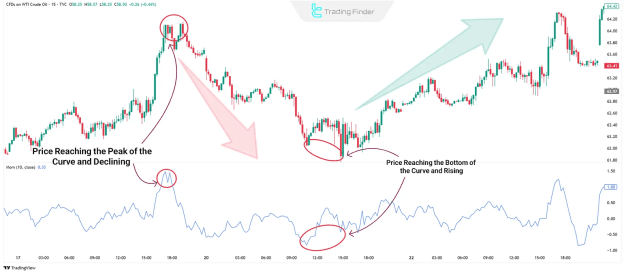
- Momentum: A simple yet effective oscillator that measures the rate of price change. A peak in the momentum curve followed by a decline can signal a sell signal, while a trough followed by a rise can indicate a potential buy signal.
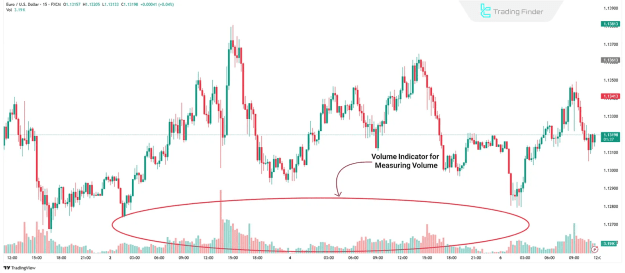
Volume Indicators
While the Forex market is decentralized and lacks centralized volume data, volume indicators can help traders estimate buying and selling pressure.
- On-Balance Volume (OBV) and Accumulation/Distribution (A/D): These indicators track the cumulative flow of volume, providing clues about whether buying or selling pressure is dominating the market.
Practical Tips for Using Indicators
To get the most out of Forex indicators, consider these professional practices:
- Combine Tools: Using multiple indicators in tandem can help filter out false signals and confirm trading opportunities.
- Match Settings to Your Strategy: Adjust indicator settings to suit the specific currency pair, timeframe, and trading style you are using.
- Confirm with Price Action: Always use indicators as a complement to a deeper analysis of market structure, such as trend lines, support and resistance levels, and price patterns.
Conclusion
Forex indicators and oscillators are essential analytical tools that provide a statistical framework for understanding market dynamics. By effectively utilizing tools like Moving Averages to identify trends, RSI to measure momentum, and Volume indicators to gauge pressure, traders can enhance their ability to forecast price movements and execute trades with greater precision.