By applying the ADX, traders can avoid low-momentum trades and focus on opportunities aligned with strong market trends.
Prop Firm DrawDown Protector : Prop Firm Capital Protection Expert MT4 |Forex Money Management: Forex Trade Management Expert MT4 |ICT Concepts Indicator MT4 | Smart Money Concepts Expert MT4| Get a free Expert Advisor license via Telegram and WhatsApp
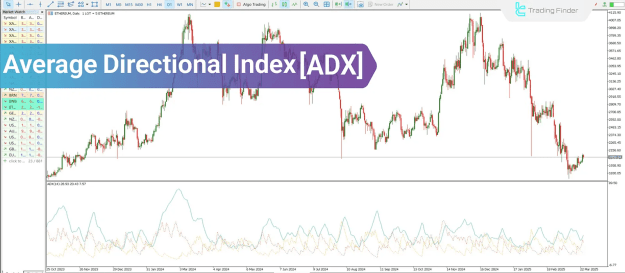
What Is the Average Directional Index (ADX)?
The ADX Indicator is a trend strength tool that functions independently of price direction. It assists in determining whether the market is experiencing a sustained trend or trading within a horizontal range.
This makes the ADX particularly valuable for selecting appropriate charts and validating trend continuation entries in various market environments.
Key Components of the ADX Indicator
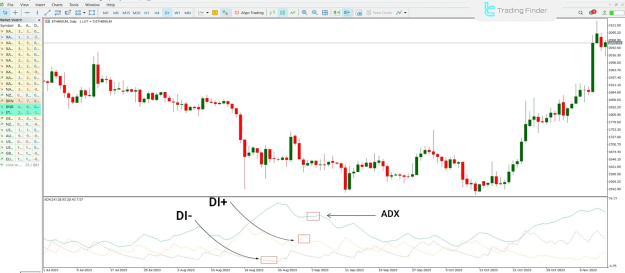
The ADX consists of three interrelated elements:
- +DI (Positive Directional Indicator)
- –DI (Negative Directional Indicator)
- ADX (Average Directional Index)
These components work collectively to assess the strength of directional price movement. The ADX itself is calculated by taking the difference between +DI and –DI and applying a moving average, typically over 14 periods, to smooth the result.
How the ADX Is Calculated
Step 1: Determine Directional Movement (DM)
- If (Today’s High – Yesterday’s High) is greater than (Yesterday’s Low – Today’s Low) → assign as positive DM
- If (Yesterday’s Low – Today’s Low) is greater than (Today’s High – Yesterday’s High) → assign as negative DM
- If neither condition is met, both values are zero.
Step 2: Calculate +DI and –DI
- Divide the respective DM values by the Average True Range (ATR).
- Smooth the values using a defined period (commonly 14) to obtain the +DI and –DI lines.
Step 3: Calculate the Directional Index (DX)
- Use +DI and –DI values to compute the Directional Index, which reflects the strength of the price movement’s direction.
Step 4: Derive the ADX Value
- Apply an exponential moving average (EMA) to the DX values to generate the ADX line over the selected period.
How to Interpret ADX Readings
The ADX outputs values on a scale from 0 to 100, offering a clear view of trend strength:
- ADX below 20: Weak trend or ranging market
- ADX above 50: Strong trending conditions
While the ADX does not indicate trend direction, the accompanying +DI and –DI lines provide insight into whether bullish or bearish momentum is prevailing.
Applying ADX to Identify Trend Strength
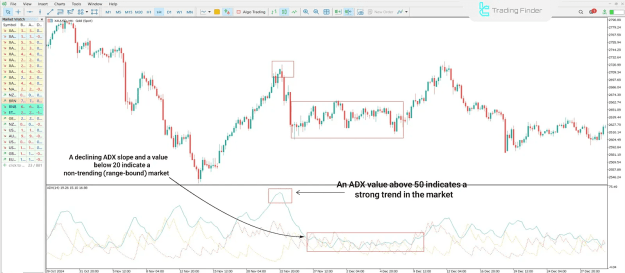
A rising ADX line indicates growing momentum within the trend. Conversely, a falling ADX suggests diminishing strength and a possible transition into a consolidation phase.
For example, on the 4-hour chart of XAUUSD (Gold vs. USD):
- An ADX above 50 with an upward slope signifies a powerful trend.
- If the ADX slope begins to fall and dips below 20, this typically reflects market indecision and range-bound behavior.
Enhancing ADX Analysis with Other Indicators
Since the ADX measures only trend strength, it is most effective when combined with indicators that define trend direction or market condition.
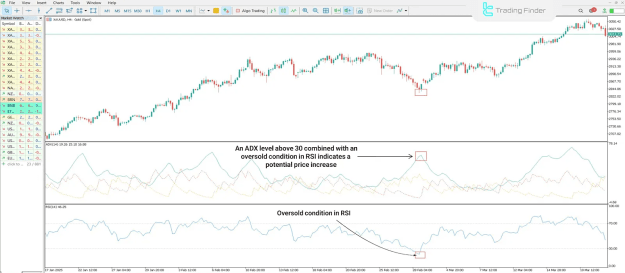
ADX Combined with RSI
- The Relative Strength Index (RSI) highlights overbought and oversold zones, particularly in sideways markets.
- When ADX > 25–30 and RSI rebounds from oversold levels, this may suggest the onset of a bullish trend.
- In trending environments, RSI reversals from overbought levels can act as early bearish signals.
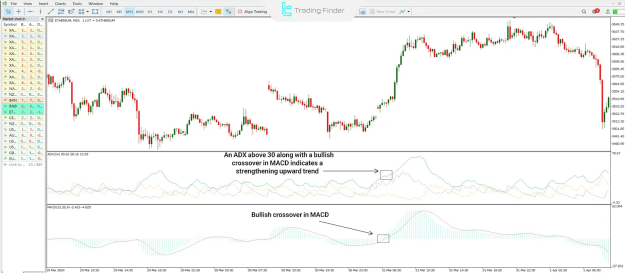
ADX Combined with MACD
- The MACD (Moving Average Convergence Divergence) indicator provides directional and momentum insights.
- A bullish crossover in MACD accompanied by an ADX > 30 increases confidence in a strong upward move.
- Similarly, a bearish MACD crossover with a rising ADX supports continuation of a downward trend.
Common Errors When Using the ADX Indicator
Traders may encounter challenges with the ADX if misused. The following are frequent mistakes:
- Treating ADX as a Signal Generator
ADX is not designed to generate buy/sell signals but to evaluate trend strength. It should be used in conjunction with direction-based tools. - Overlooking the ADX Slope
A rising ADX, even below 25, may indicate increasing momentum. A declining ADX, even above 40, could signal weakening momentum. - Relying on ADX in Low-Volatility Markets
During low-volume or quiet sessions, ADX signals can be misleading. Confirmations from price action or volume are necessary. - Misjudging Timeframe Relevance
ADX values should be interpreted in the context of the timeframe analyzed. What appears strong on the daily chart may be insignificant on an intraday chart. - Ignoring Market Structure and Price Action
Integrating ADX with support/resistance zones, candlestick patterns, or breakout levels provides more reliable trade setups.
Conclusion
The Average Directional Index (ADX) is a powerful trend strength indicator that adds clarity to market conditions by identifying trending versus non-trending environments. Though it does not determine trend direction, when combined with tools such as RSI, MACD, or key price structures, it greatly enhances trading decisions.
Key takeaways for using the ADX effectively:
- Focus on the slope and value of ADX for trend assessment.
- Combine it with directional indicators and price action tools.
- Be mindful of timeframe differences and avoid over-reliance during low-volatility periods.
When used properly, the ADX becomes an invaluable component for filtering trades and identifying high-probability opportunities in dynamic markets.