TP & SL Tool: Risk Reward Ratio Calculator RRR MT4 | Prop Firm Protector: Trade Assist Prop Firm Plus TF Expert MT4 | Money Management + DrawDown Protector: Trade Panel Prop Firm Drawdawn Limiter Pro MT4 |Get a free Expert Advisor license via Telegram and WhatsApp
When Does a Reversal Occur?
Reversals typically form at key zones where buying or selling pressure reaches its peak, and the opposing market force gains dominance. Key indicators of a potential reversal include:
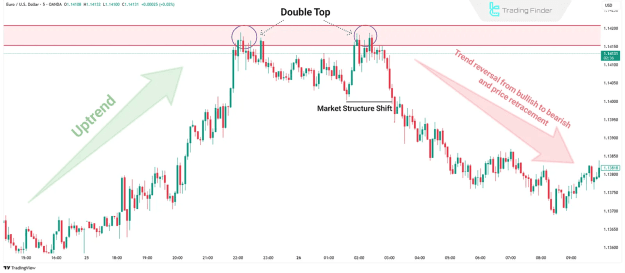
- Market Structure Shift (MSS): In an uptrend, a strong reversal signal appears if the price fails to establish a new higher high and subsequently breaks below the preceding lower low.
- Momentum Loss: A deceleration in momentum or the appearance of weaker continuation candles often suggests the current trend is nearing its end.
- Formation of Consolidation or Reversal Patterns: Specific chart patterns such as double tops/bottoms, head and shoulders, or reversal candlesticks like pin bars and engulfing candles frequently emerge at turning points.
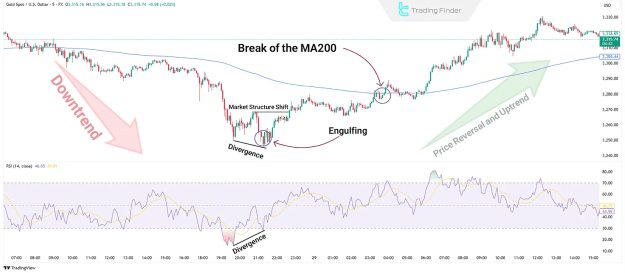
- Indicator Divergence: A discrepancy between price movement and a technical indicator (e.g., Relative Strength Index (RSI) or MACD) indicates a weakening correlation and potential reversal.
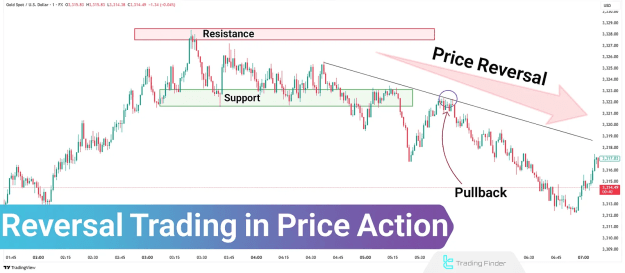
Difference Between Reversal and Pullback
While reversals and pullbacks may initially appear similar, their fundamental difference lies in their impact on trend continuation.
- Pullback:
- Market Direction: Continues the original trend.
- Duration: Short-term.
- Price Objective: Resumes the previous trend.
- Example in Uptrend: A temporary dip in price before the uptrend continues.
- Reversal:
- Market Direction: Changes the prevailing trend.
- Duration: Medium to long-term.
- Price Objective: Initiates a new trend in the opposite direction.
- Example in Uptrend: A continuous drop in price, signaling the start of a downtrend.
What Is a Reference Point in Reversal Trading?
A Reference Point is a critical area where traders anticipate a potential trend change. These points are typically identified through historical price behavior or established technical analysis tools:
- Support and Resistance Levels
- Trendlines
- Moving Averages (e.g., the 200-period Moving Average (MA200))
- Supply and Demand Zones
Three Methods to Identify a Trend Reversal
Reversals offer significant entry opportunities for traders. To enhance accuracy, professional traders often combine structural analysis with multi-timeframe analysis.
- Market Structure Shift (MSS): Healthy trends are characterized by consistent higher highs and higher lows in an uptrend, or lower lows and lower highs in a downtrend. A failure to form a new extreme (high or low) followed by a break of the preceding corrective extreme suggests a significant trend change.
- Reversal on Higher Timeframe: Signals observed on lower timeframes can often be misleading. To mitigate false signals, always validate potential reversals by examining price action on higher timeframes (e.g., confirming a 15-minute chart reversal on a 1-hour or 4-hour chart).
- Break of 200 Moving Average (MA200): The 200-period moving average is a widely recognized indicator of long-term trend. A price break below the MA200 typically suggests a shift to a bearish trend, whereas a break above it indicates a bullish reversal.
Identifying Fake Reversals
Fake reversals are a common pitfall that can lead to premature stop-loss triggers. Traders can minimize these occurrences by analyzing:
- Multi-timeframe confirmation: A reversal signal on a short-term chart (e.g., 5-minute or 15-minute) should be confirmed by observing corroborating price action on longer timeframes (e.g., 1-hour or 4-hour).
- Context matters: A reversal signal appearing in the middle of a trading range, rather than at a defined key zone, is more likely to be false.
- Clear candle confirmation: Reversal candlestick patterns must be strong and accompanied by high volume. Weak or low-volume candles can be deceptive.
The most effective defense against fake reversals is a comprehensive approach that integrates multi-timeframe analysis, candlestick pattern interpretation, and key zone validation.
Example of Short Reversal Trade
Consider a scenario on the EUR/USD chart. If the price fails to create a new high and subsequently breaks below its previous low, this presents an initial indication of a potential bearish reversal. Instead of entering immediately on higher timeframes, traders should wait for confirmation on lower timeframes (e.g., 15-minute or 1-hour chart) through the formation of supply zones and bearish reversal candlesticks such as bearish engulfing patterns or pin bars.
The stop-loss for such a trade would typically be placed above the confirmed supply zone, with targets set at previous support and resistance levels or based on a predetermined risk-reward ratio.
Example – Long Reversal Trade
Following a sharp decline in an asset like gold, many might anticipate further downward movement. However, if this decline is succeeded by divergence between price and a momentum indicator, the appearance of reversal candlesticks, and the formation of a support zone, there could be a strong potential for a bullish reversal.
Traders should await a clear reaction within the support zone, such as a bullish engulfing pattern or volume-backed consolidation. If the price then forms a higher low, it further confirms the shift towards an uptrend. Stop-loss orders would be positioned below the support zone, and profit targets would be determined by resistance levels or a favorable risk-reward assessment.
Conclusion
Reversal trades, when executed with meticulous analysis, can offer substantial trading opportunities. The key to success is not merely identifying any unusual candle, but accurately pinpointing when and where a reversal is genuinely forming. Without compelling evidence, such as a market structure shift, indicator divergence, or higher-timeframe validation, entering reversal trades carries considerable risk.