TP & SL Tool: Risk Reward Ratio Calculator RRR MT4 | Prop Firm Protector: Trade Assist Prop Firm Plus TF Expert MT4 | Money Management + DrawDown Protector: Trade Panel Prop Firm Drawdawn Limiter Pro MT4 |Get a free Expert Advisor license via Telegram and WhatsApp
What Is the Fractal and Inversion Strategy in ICT Style?
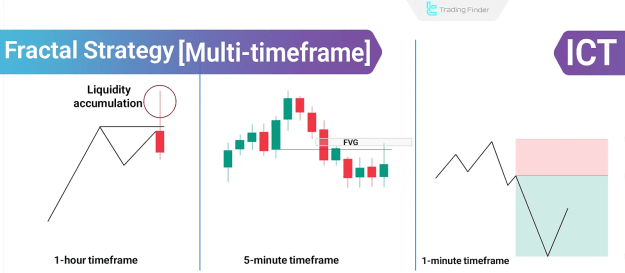
The Fractal model within the ICT framework focuses on aligning price structure across various timeframes to pinpoint reactive market entry zones. It identifies a price structure Inversion by first analyzing higher timeframe candles for directional bias, then confirming this structure on a mid-timeframe, and finally executing trades on a lower timeframe. The T-Spot, which represents the optimal entry zone, is where the wick of the higher timeframe candle is anticipated to form.
Process of Applying the Fractal Strategy:
The application of the Fractal Strategy involves a systematic, three-step process:
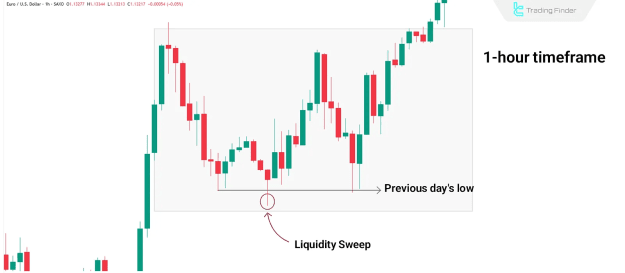
- Identifying Reversal Zone on Higher Timeframe: The initial step involves utilizing a higher timeframe, such as the 1-hour (1H) or Daily chart, to pinpoint potential price reversal zones. These zones are typically characterized by the collection of liquidity followed by candlestick rejections.
- Receiving Structural Confirmation on Mid Timeframe: Subsequently, structural confirmation is sought on a mid-timeframe, commonly the 5-minute (5M) chart. This step is crucial for validating the potential entry opportunity.
- Entry on Lower Timeframe: The final stage involves executing the trade on a lower timeframe, such as the 1-minute (1M) chart, once the price demonstrates a valid structural Inversion or a confirmed reversal within the pre-defined zone.
High Timeframe Analysis in Fractal and Inversion
In the Fractal model, determining the initial market bias is foundational and is derived from higher timeframes (e.g., 1H). This higher timeframe direction is critical, as entries lacking this confirmed bias are considered unsubstantiated.
Three Primary Methods for Identifying Bias:
- Liquidity Sweep: A swift breach and subsequent rejection of a significant high or low on the higher timeframe suggests the presence of smart money activity. For instance, if a candle breaks the previous day's high but fails to sustain the upward movement, closing below that high, it often signals the potential end of a bullish trend.
- Rejection: Following a liquidity sweep, a confirmed price rejection from the liquidity zone is required. This is typically indicated by a candle closing in the opposite direction (e.g., a bearish close after a high sweep).
- Change in State of Delivery: This involves observing a notable shift in market behavior, frequently identified by a strong candle close that decisively surpasses previous candles (e.g., a powerful bearish candle breaking past preceding bullish candles).
Confirming Structure in Mid Timeframe (e.g., 5-Minute)
After establishing the higher timeframe bias, obtaining structural confirmation on the mid-timeframe (e.g., 5M) is paramount. Without a clear reversal structure at this stage, any subsequent entry on lower timeframes lacks validity.
What Does Breaking Up Close or Down Close Candles Mean?
In ICT's Fractal model, the confirmation of a structural change often necessitates breaking through a series of specific candles that signify the preceding trend:
- Up Close Candles: These are bullish candles that close above their open price.
- Down Close Candles: These are bearish candles that close below their open price.
Defining the T-Spot Zone
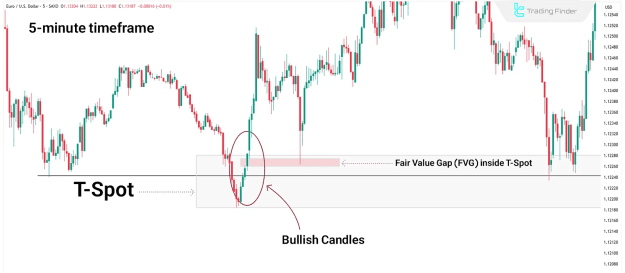
The T-Spot signifies the expected area where the wick of the higher timeframe candle will form. It is the sole valid entry zone, determined only after the establishment of higher timeframe bias and structural confirmation on the mid-timeframe (e.g., 5M). A T-Spot becomes valid when the price breaches several bullish or bearish candles and subsequently forms key areas such as a Fair Value Gap (FVG) or an Order Block (OB) within the middle of that break.
Entry Using Fractal and Inversion on Lower Timeframe (1-Minute)
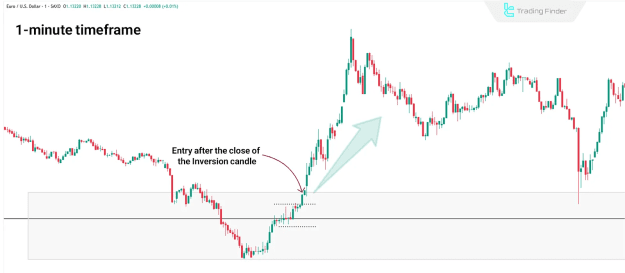
Once the bias has been identified on the higher timeframe and the structure confirmed on the mid-timeframe, an entry becomes valid exclusively when a confirmed Inversion appears within the T-Spot on the 1-minute (1M) chart. This point represents the optimal entry for achieving tight stop-losses and favorable Risk:Reward (R:R) ratios.
Entry Types in Fractal Strategy:
Upon the appearance of the "Inversion," two distinct entry types are possible within the Fractal Strategy:
- Close Entry: This occurs after the Inversion candle closes, thereby confirming the signal.
- Retest Entry: This involves entering when the price retests the broken level, potentially allowing for an even tighter stop-loss and an improved R:R.
The selection between these entry types depends on the prevailing price behavior, the specific positioning of the T-Spot, and the distance to the intended target.
Stop Placement in Fractal Strategy
Stop-loss orders must consistently be placed beyond the Inversion level:
- For Long Positions: The stop-loss should be positioned below the last wick low.
- For Short Positions: The stop-loss should be placed above the last wick high.
What's the Difference Between Inversion and Breakout?
Inversion signifies a confirmed price reversal originating from a specific zone. It involves the price initially breaking a level (such as a short-term high or low), followed by an immediate return and close in the opposite direction. In contrast, a breakout is merely a breach of a level. The key distinction is that Inversion encompasses the breach, the return, and the subsequent close in the opposite direction, indicating a genuine market reversal rather than merely a liquidity sweep.
Conclusion
The Fractal model in ICT style provides a structured approach for aligning timeframes to achieve highly reactive market entries. It begins with identifying the directional bias on a higher timeframe through liquidity collection and rejection. Subsequently, a structural shift is confirmed on the mid-timeframe by observing the breaking of prior candles. Entry is deemed valid only when the price demonstrates a confirmed Inversion within the T-Spot on the 1-minute chart. This meticulous strategy facilitates precision entries, enables the use of tight stop-losses, and ultimately leads to enhanced risk control.