TP & SL Tool: Risk Reward Ratio Calculator RRR MT4 | Prop Firm Protector: Trade Assist Prop Firm Plus TF Expert MT4 | Money Management + DrawDown Protector: Trade Panel Prop Firm Drawdawn Limiter Pro MT4 |Get a free Expert Advisor license via Telegram and WhatsApp
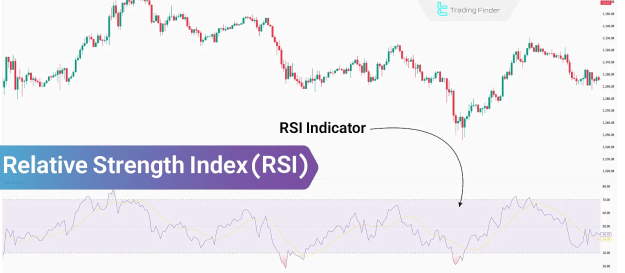
Due to its analytical capabilities, RSI is applied in various trading strategies, including divergence detection, trendline analysis, and the identification of overbought and oversold market conditions.
Key Features of RSI
- Measures trend momentum
- Identifies potential overbought and oversold zones
- Operates within a 0–100 scale
When RSI exceeds 70, it indicates an overbought market, whereas a reading below 30 signals an oversold market condition.
Components of the RSI Indicator
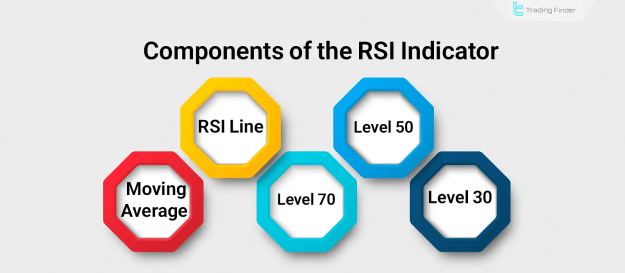
The RSI comprises five primary components, each essential for precise market analysis.
Main Components of RSI
- RSI Line: The central element that reflects relative price strength through a defined formula.
- RSI Moving Average: A moving average of the RSI line; its crossovers can indicate possible trend reversals.
- Level 70: Represents the upper boundary, where readings above this level suggest an overbought condition.
- Level 50: Serves as the midpoint, often acting as a dynamic support or resistance area.
- Level 30: Defines the lower boundary, with readings below this level indicating an oversold condition and potential bullish reversal.
Advantages and Disadvantages of RSI
Understanding the strengths and limitations of RSI is vital before integrating it into trading strategies.
Advantages
- Generates clear and straightforward signals
- Easily combined with other technical analysis tools
- Applicable to various financial markets
Disadvantages
- May generate delayed signals
- Susceptible to false signals in ranging markets
- Requires combination with additional analytical methods for optimal results
How is RSI Calculated?
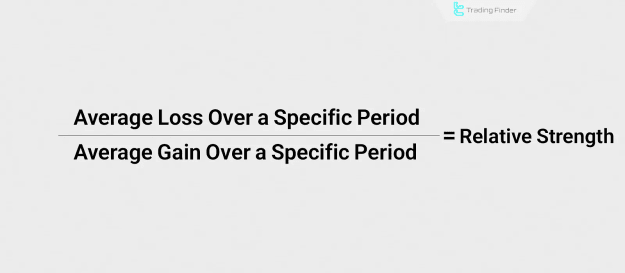
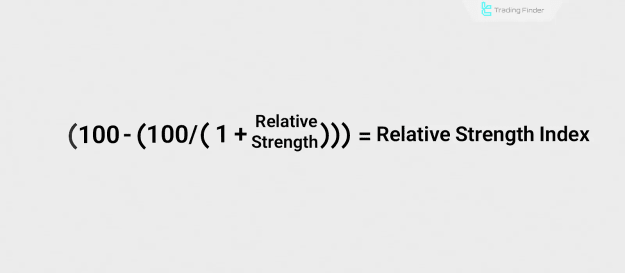
The calculation of RSI involves two sequential stages. First, Relative Strength (RS) is determined, followed by its application in the RSI formula.
Formula for Calculating Relative Strength
Relative Strength = Average Gain / Average Loss
Formula for Calculating RSI
RSI = 100 – [100 / (1 + RS)]
RSI Settings
RSI calculations are based on a defined timeframe. Adjusting the period alters signal sensitivity:
- Default: 14 periods
- Shorter periods: Increase sensitivity and produce more frequent signals
- Longer periods: Reduce signal frequency, enhancing accuracy by filtering out noise
Applications of RSI
The RSI indicator is highly versatile and is used for multiple analytical purposes.
Key Applications of RSI
- Support and Resistance Identification: The level 50 midpoint indicates equilibrium between buyers and sellers, functioning as a potential support or resistance level.
- Overbought and Oversold Detection: Readings above 70 suggest overbought conditions, while those below 30 indicate oversold conditions.
- Take Profit and Stop Loss Placement: RSI readings help in determining optimal take profit and stop loss zones.
- Trend Continuation Confirmation: RSI readings above 50 support bullish continuation, while readings below confirm bearish momentum.
- Divergence Analysis: Highlights inconsistencies between price movements and RSI, indicating possible trend reversals.
Divergence in RSI
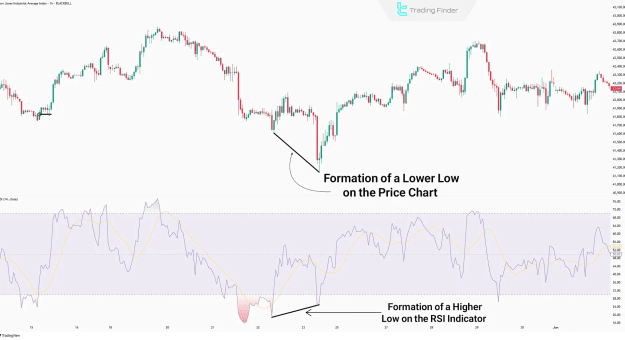
Divergence occurs when price action and RSI movements are misaligned, often signalling a reversal in the current trend.
Regular Divergence
Occurs when:
- The price forms new highs (uptrend) or new lows (downtrend)
- RSI fails to replicate these highs or lows, indicating a potential reversal
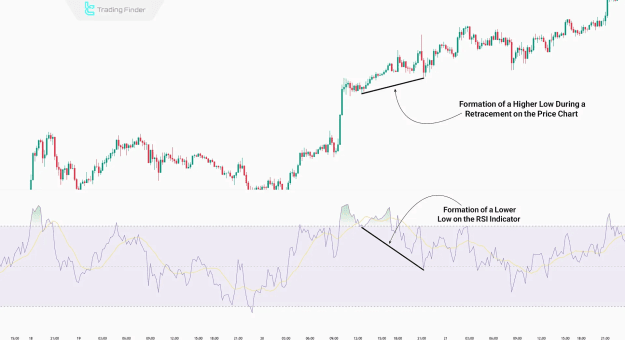
Hidden Divergence
Occurs during trend retracements:
- Formation of a low (in uptrends) or high (in downtrends) during retracement
- RSI readings diverge from price action, suggesting continuation of the prevailing trend
Trading Strategies Using RSI
The RSI indicator is integrated into numerous trading strategies to improve trade execution accuracy.
Common RSI-Based Strategies
- Divergence Strategy: Identifying divergence between price and RSI to generate trade signals.
- Trendline Strategy: Drawing trendlines on both RSI and price charts; simultaneous touches trigger entry signals.
- Combined Overbought/Oversold and Support/Resistance Strategy: Utilises support or resistance levels in conjunction with RSI divergence to generate entry signals in the direction of the anticipated reversal.
Enhancing RSI Effectiveness
Using RSI alone may increase trading risks. Its performance is enhanced when combined with other technical analysis tools.
Recommended Tools to Combine with RSI
- Classic chart patterns
- Candlestick patterns
- Support and resistance analysis
- Stochastic Oscillator
- Average True Range (ATR)
- Moving Averages
Conclusion
The Relative Strength Index (RSI) is an essential momentum oscillator for measuring trend strength over defined periods, commonly set at 14 days. Its capability to identify overbought and oversold conditions, detect divergences, and assess support and resistance zones makes it a valuable tool for traders across all financial markets and technical analysis strategies.