TP & SL Tool: Risk Reward Ratio Calculator RRR MT4 | Prop Firm Protector: Trade Assist Prop Firm Plus TF Expert MT4 | Money Management + DrawDown Protector: Trade Panel Prop Firm Drawdawn Limiter Pro MT4 |Get a free Expert Advisor license via Telegram and WhatsApp
What Is RTM Style?
RTM Price Action centers on identifying specific zones where large investors have executed substantial entries or exits. These critical areas, known as price nodes, gain analytical significance only when correlated with market structure, candle types, and liquidity behavior.
This methodology utilizes several powerful tools to reveal the subtle movements of large capital volumes that often leave no obvious traces. The most crucial tools within RTM Style include:
- Price structures such as Rally-Base-Rally (RBR), Drop-Base-Drop (DBD), and others.
- Supply and Demand Zones.
- Identification of Momentum and Base Candles.
- Liquidity behaviors, including stop hunts and compressions (CP).
- The pivotal role of price nodes integrated with the concept of Nested Zones.
Ultimately, the goal of RTM is to identify high-probability entry points with minimal stop-losses, derived directly from actual market behavior.
Advantages and Disadvantages of RTM Style
Before adopting and applying RTM Style, a comprehensive understanding of its strengths and weaknesses, particularly concerning price behavior and order flow analysis, is essential.
Advantages
- Accurate identification of large market players' behavior.
- Focus on market logic rather than external indicators.
- Offers a high risk-to-reward ratio in trades.
- Applicable across all timeframes and markets (e.g., Forex, Crypto).
- Detailed analysis of decision-making zones and liquidity.
- Ability to filter weak zones using key factors.
Disadvantages
- Requires considerable time and experience to master the underlying concepts.
- Highly complex for beginner traders.
- Low win rate if the analysis is executed poorly.
- High chance of counter-trend trades if higher timeframes are disregarded.
- High potential for misinterpretation of structures without proper training.
- Lack of comprehensive educational standards and scattered learning resources.
Candles in RTM Style
In RTM Style, candle analysis is predicated on their dominance over one another, rather than their specific names or visual patterns. For instance, a bullish green candle that fully engulfs the preceding bearish candle signifies the dominance of buyers in the market. The primary candle types utilized in RTM include:
- Base Candles.
- Momentum Candles.
RTM Base Candle
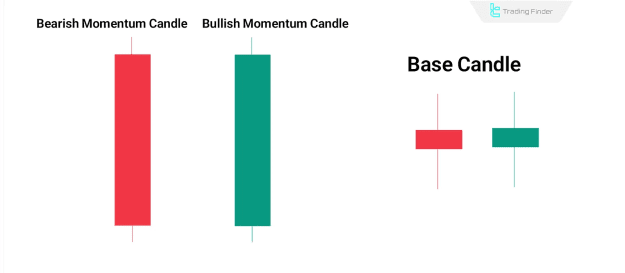
A Base Candle signifies a moment of relative equilibrium between buyers and sellers. This candle typically forms immediately preceding or following sharp price movements.
Key characteristics of a Base Candle:
- Smaller body in relation to the total wick length.
- Its bullish or bearish color does not influence zone analysis.
- Indicates a price pause, compression, or preparation for the subsequent move.
- Forms the foundation for drawing supply and demand zones in RTM structures.
RTM Momentum Candle
A Momentum Candle clearly indicates the decisive dominance of one market side (either buyers or sellers).
Key characteristics of a Momentum Candle:
- Body is larger than the total wick length.
- Features short or no wicks (no wick is considered ideal).
- Exhibits a clear directional bias; for example, a bullish candle opens low and closes high, demonstrating strong buying pressure.
- Signifies fast and decisive price movement.
Differences Between Momentum Candle and Base Candle in RTM Style
Recognizing the distinction between Momentum and Base Candles is fundamental to applying RTM Style effectively. This differentiation serves as the cornerstone for identifying core market structures.
Characteristic
Momentum Candle
Base Candle
Body
Large
Small
Wicks
Short or none
Typically long
Price Behavior
Strength and dominance
Pause and balance
Usage
Confirms trend direction
Basis for zone drawing
Export to Sheets
Core Concepts of RTM Style
Three fundamental concepts constitute the analytical bedrock of RTM Style. A thorough understanding of these concepts facilitates precise market analysis and high-probability entry points:
- Market Structure.
- Supply & Demand Zones.
- Liquidity.
Market Structure in RTM Price Action
Market structure elucidates the directional movement of price, aiding in the identification of the dominant trend and potential reversal points. Core elements include:
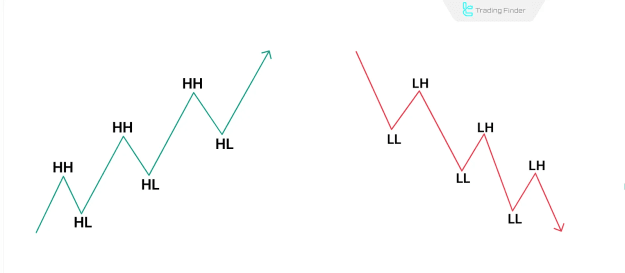
Higher High (HH) and Higher Low (HL)
If new highs and lows are formed above their preceding levels, the prevailing trend is bullish, indicating that buyers are in control and driving prices upward.
Lower Low (LL) and Lower High (LH)
Conversely, if each new low and high is situated below the last, the market is in a bearish trend, signaling stronger selling pressure and a propensity for prices to decline.
Structure Break in RTM Method
A Structure Break occurs when the price breaches an important high or low in the direction of the current trend. This event confirms trend continuation and is a critical signal in RTM analysis.
Trend Reversal in RTM Style
A break of a significant high or low for the first time signals the end of the current trend and the potential initiation of a new trend. For example, if the price breaks a key low during an uptrend, it could signify the beginning of a downtrend.
Supply & Demand Zones in RTM Price Action
These zones represent areas where an imbalance between buyers and sellers leads to price reversals. Key components include:
Demand Zone in RTM
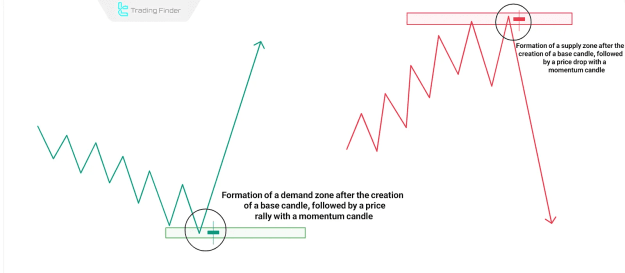
A Demand Zone is a region on the chart from which the price previously rallied strongly. This indicates a concentration of strong buy orders and suggests that the zone may again fuel price growth upon retesting.
Supply Zone in RTM
Conversely, a Supply Zone is a region from which prices previously experienced a sharp decline. This signifies seller dominance and suggests that the zone may again push prices lower upon retesting.
How to Precisely Draw Zones in RTM Style?
Supply and demand zones in RTM are typically delineated by combining Base Candles and Momentum Candles. The zone's range is defined between the last neutral candle (base) and the first strong impulse candle. The faster and more forceful the movement away from the zone, the higher its validity.
Hidden Orders
RTM Style postulates that some buy or sell orders remain within these zones, and prices are likely to react again upon returning to them.
Liquidity in RTM Style
Liquidity is not merely a secondary factor in RTM; it is considered the target for price movement and the fundamental fuel that powers price action. The analyst must identify where the market is heading to absorb liquidity and where it is most likely to be removed.
Stop-Loss Clusters in RTM Price Action
Numerous stop losses are typically positioned behind major highs and lows. Market makers often target these zones because triggering stops injects essential liquidity into the market, facilitating their larger order execution.
Stop Hunt in RTM
Occasionally, price will swiftly move into specific zones with the explicit purpose of triggering stop-losses. This movement is generally short-term and temporary, but its primary goal is to absorb liquidity necessary for the continuation of the main trend.
The Four Market Structures in RTM Style
The four core structures in RTM Price Action represent the most fundamental price movements. These patterns are instrumental in identifying decision-making zones and potential reversal or continuation points. Each structure comprises two upward and two downward movements. Key RTM Style structures include:
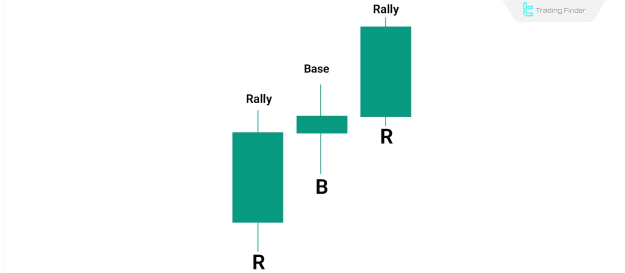
- Rally–Base–Rally (RBR)
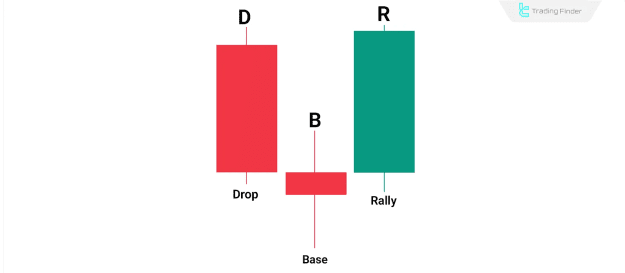
- Drop–Base–Rally (DBR)
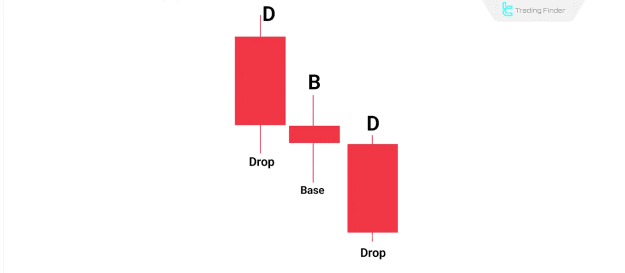
- Drop–Base–Drop (DBD)
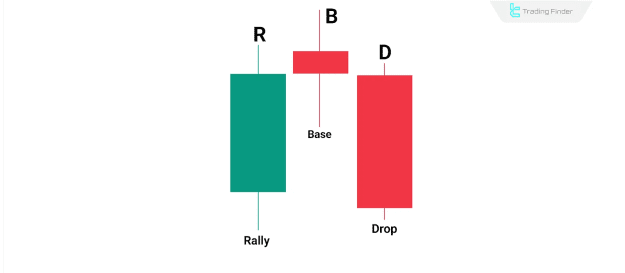
- Rally–Base–Drop (RBD)
Rally–Base–Rally (RBR) in RTM Method
Price rallies upward, enters a base phase (indicating balance), and then resumes its bullish movement with increased momentum. This structure signifies active buyers exhibiting strong momentum.
Use Cases of RBR:
- Entry after a pullback to the base zone for long positions.
- Ideal for identifying sustained bullish trends.
Drop–Base–Rally (DBR) in RTM Style
Price experiences a drop (Drop), stabilizes in a base, and then reverses upward (Rally). This pattern reflects the absorption of buy orders and the cessation of selling pressure.
Use Cases of DBR:
- Effective for identifying the conclusion of bearish corrections.
- The base zone typically hosts unfulfilled buy orders.
Drop–Base–Drop (DBD) in RTM
Price declines due to selling pressure, pauses in a base, and then continues falling as sellers re-engage. This structure signals complete seller control.
Use Cases of DBD:
- Entry for short positions after a retest of the base.
- Indicates a strong bearish trend with high validity.
Rally–Base–Drop (RBD) in RTM
Price initially rallies, pauses in a base, and then drops as selling pressure emerges. This indicates buyer exhaustion and the introduction of new selling interest.
Use Cases of RBD:
- Useful for identifying the termination of rallies.
- The base zone becomes an optimal entry point for short trades.
Zones in RTM Style
Within RTM, specific supply and demand zones hold greater significance. Based on their formation and how price interacts with them, zones are classified into three distinct types:
- Authentic Zone.
- Reaction Zone.
- Fresh Zone.
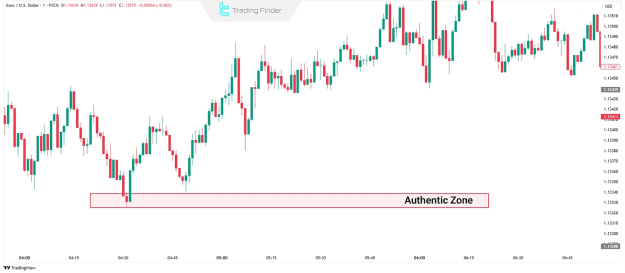
Authentic Zone in RTM Style
An Authentic Zone in RTM Price Action is a region where, for the first time, a pronounced imbalance between buyers and sellers generated a powerful price movement.
This zone is not based on reactions to pre-existing structures. Instead, it functions as the original source of major orders and does not overlap any previous zone. Consequently, it is considered the most valid and reliable zone in RTM.
Reaction Zone in RTM Method
A Reaction Zone is an area that the price has previously reacted to, and where a new structure subsequently forms. It typically overlaps an older zone and may trigger another reaction due to unfulfilled historical orders.
Given that it is not the origin of the initial move, this zone is less reliable than an Authentic Zone and necessitates additional confirmation, especially on lower timeframes, prior to trade entry.
Fresh Zone in RTM
A Fresh Zone in RTM Style is a region that, once formed, has not yet been touched by price. Because no orders have been triggered there, it possesses the highest potential to cause a strong reaction upon the first touch.
This initial interaction, termed FTB (First Time Back), is frequently a high-probability reversal point. Therefore, Fresh Zones are prioritized over tested zones when seeking trading opportunities in RTM Price Action.
Criteria for Zone Validity in RTM Price Action
In RTM, the validity of a zone is not merely determined by its visual appearance. Instead, it depends on how the price behaves around that area and whether it demonstrates potential for reversal or continuation.
Base Candle Quality in RTM Style
For a zone to be considered valid in RTM, it must commence with a clear, high-quality base candle—a moment where the market pauses and exhibits a relative balance between buyers and sellers.
If the base is excessively large, extended, or composed of multiple candles, the zone’s validity is diminished. Even with a strong breakout or if it's a Fresh Zone, it cannot be reliably trusted unless the base is compact, clear, and well-defined. Without this criterion, analyzing other factors becomes irrelevant.
Departure Strength in RTM Style
One of the most crucial indicators of a zone's validity in RTM Style is the strength of the price's departure from it. If the price exits the zone with a series of strong and consecutive momentum candles, it signals the presence of significant orders and a clear market imbalance.
Conversely, if the price leaves the zone with only a single weak candle and then pauses or reverses, it is likely that the zone is weak or lacks sufficient liquidity. Therefore, a strong, impulsive departure is a clear sign of zone credibility and significant decisions made by major market participants.
Alignment with Higher Timeframe Trend in RTM Method
Respecting the higher timeframe trend plays a pivotal role in validating zones within RTM. If the direction of price movement in the analyzed timeframe corresponds with the higher timeframe trend, there is a greater probability that the zone will react effectively, and the price will continue in the same direction.
This alignment indicates that the trade is in harmony with the dominant liquidity flow. Conversely, if the analyzed timeframe contradicts the higher timeframe trend—even if the zone appears structurally sound—there is a heightened risk of invalidity or sudden reversal. Thus, aligning with higher timeframe trends is a critical method for reducing trade risk in RTM Price Action.
Types of Setups and Patterns in RTM Style
In RTM Style Training, trading setups are defined based on price behavior within key zones and structure breaks. These setups form the core of trade entries and are each rooted in the logic of liquidity and reactions from large market participants.
Engulfing Pattern in RTM
The Engulfing pattern in price action is one of the clearest indications of a shift in control between buyers and sellers. This pattern occurs when one candle completely engulfs the preceding candle in terms of its opening and closing price.
If the second candle is bullish and fully covers the previous bearish candle, it is termed a Bullish Engulf, signifying strong buyer entry and likely upward movement. Conversely, if the second candle is bearish and engulfs a bullish candle, it forms a Bearish Engulf, suggesting a potential price decline.
In RTM Style, engulfing is not confined to individual candles. A sudden and powerful break of a supply or demand zone is also considered a structural engulf. It is a critical tool for identifying trend reversals, the entry of large players, and zone validation.
FL (Fail to Return) Setup in RTM
The FL Setup is a widely utilized entry pattern in RTM Style, predicated on the forceful break of key Support and Resistance (SR) zones, leading to the formation of a new, valid trading area.
As the price approaches an important SR zone, it often pauses briefly, forming tight base candles. After breaking the zone—frequently creating a structure like DBD or RBR—a new area forms on the broken SR level, known as the FL Zone.
Key Traits of the FL Setup:
- A strong and rapid departure from the SR zone.
- Minimal pause before the break, indicating untriggered pending orders that react upon retest.
- Sometimes, the base candle is indistinct; switching to a lower timeframe helps in its identification. If a gap forms without a visible base, the gap itself may signify rapid price departure—though this introduces additional risk.
FTR (Fail to Return) Pattern in RTM
The FTR Setup is a continuation pattern in RTM Price Action based on the price failing to return to a broken SR zone.
Price first engulfs an SR level with a momentum candle, then continues its movement and creates a new SR. On the subsequent pullback, it fails to reach the original SR, instead pausing nearby and forming a base candle, thereby creating what is known as the FTR Zone.
Price then breaks the second SR with force. Upon returning to the FTR Zone, it often reacts strongly, offering a potential trade entry. This setup is characterized by two consecutive breaks in the direction of the new trend—a clear sign of strength.
If the FTR Zone is later broken in the opposite direction, it may signal trend exhaustion and the initiation of a new structure.
Caps Pattern in RTM Price Action
The Caps Pattern in RTM Style is a reversal setup that typically forms near market highs. Price initially rises with momentum, and professional traders take partial profits, resulting in a minor correction. Price then ascends again, attracting inexperienced traders into false long positions.
At this juncture, smart money absorbs liquidity and executes substantial selling, thereby reversing the trend. The zone formed immediately before the sharp drop becomes the Caps Zone, which is suitable for high-risk-to-reward short entries.
Swap Setup in RTM
In the Swap Setup, a strong supply or demand zone undergoes a role reversal when the price breaks it forcefully with momentum. The former supply zone becomes a demand zone, or vice versa.
This phenomenon occurs as retail traders enter trades against the prevailing trend, only for the price to breach the zone, triggering their stop-losses. Subsequently, when the price returns to the broken zone, these same traders now align with the trend, reinforcing the zone's new function.
PAZ (Price Action Zone) Pattern in RTM
In RTM Style, the PAZ (Price Action Zone) forms between two key structures, such as an FL or FTR. This zone typically emerges after the price breaks a previous structure against the dominant trend using a momentum move, suggesting entry into a liquidity vacuum.
Once inside the PAZ, the price often continues toward the next major structure. This zone signals a shift in order flow or trader sentiment and may offer short-term trading opportunities—though it is not ideal for major entries unless confirmed by other RTM elements.
3Drive Setup in RTM Price Action
The 3Drive pattern in RTM is a confirmation structure that analyzes price behavior before reaching a major supply or demand zone. Price forms three consecutive highs or lows, each exhibiting diminishing momentum, indicating trend exhaustion.
Although similar to Compression, the 3Drive places more emphasis on the number of waves. It is a sign of market fatigue, and when the price reaches the target zone, a reversal is highly probable.
This pattern is not used as a standalone trade entry but rather serves as a confirmation of the strength of a supply or demand zone. When combined with other signals, it enables a more accurate analysis of potential price reversals.
CP (Compression) Setup in RTM Price Action
The Compression Setup (CP) in the RTM Style indicates a gradual weakening of the dominant trend and a high probability of a sharp reversal.
In this structure, as the price approaches a significant zone, it creates several supply or demand zones that are stacked and repeatedly tested. These repeated tests drain liquidity, leaving minimal resistance when the price ultimately hits the final major zone—resulting in a strong move in the opposite direction. Demand-side compression leads to a rally, then a drop, then another rally. Supply-side compression results in a drop, a rally, then another drop.
The power of this setup is contingent upon:
- The number of tested zones.
- The depth and quality of price reactions.
Compression is most valuable as a confirmation of strong zones, as it reflects liquidity absorption and market preparation for a significant move.
Quasimodo (QM) Pattern in RTM Style
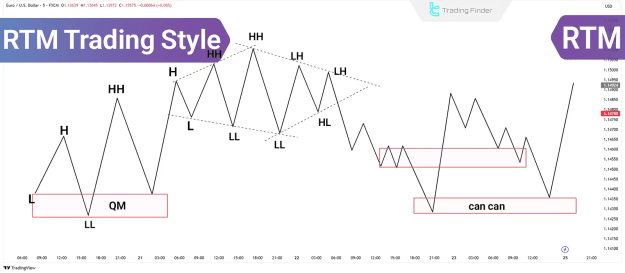
The QM pattern in RTM is a reversal structure based on consecutive structure breaks and trader manipulation. It typically appears when the dominant trend is nearing its conclusion, and the price is poised for reversal.
The pattern features two opposite engulfing moves—the first challenges the prevailing trend; the second completely invalidates it.
How to Increase QM Pattern Validity
If the final break also engulfs an old supply/demand zone, the likelihood of success is significantly higher. The QM structure is a precise signal of a true trend reversal.
Bearish QM
The Bearish Quasimodo (QM) pattern begins within an uptrend, where the price forms a Higher High (HH), followed by a pullback to a Higher Low (HL). The market then prints a new, even higher peak (HHH), continuing the bullish structure.
However, in a sudden shift, price breaks below the previous HL, signaling a loss of buyer control and the entry of strong sellers. This structural break marks a potential reversal point. The area between the last two highs (HH and HHH) becomes the QM Supply Zone, a high-probability level for initiating short trades in anticipation of a downward move.
Bullish QM
The Bullish Quasimodo (QM) pattern forms after a series of lower lows, signaling a prevailing downtrend. Suddenly, the price engulfs the previous high, indicating a shift in market sentiment and the emergence of buyer strength.
This movement often traps traders who had entered short positions based on the previous bearish structure, generating the liquidity required for a true reversal. The area between the last two lows becomes the QM Demand Zone, offering a high-probability entry point for long trades as the market transitions into a potential uptrend.
Can Can Setup in RTM
The Can Can Setup is a rare but potent reversal pattern combining elements of Caps and Compression (CP). It commences with a strong RBR structure, typically based in a demand zone.
Surprisingly, price then engulfs this demand zone. As it returns to the broken zone (Caps), it enters a compression state, forming several consecutive supply or demand areas—exhibiting CP behavior. When the price reaches the Caps zone again, lacking sufficient support liquidity, a sharp reversal occurs. This powerful reversal zone is known as the Can Can Zone, signifying the culmination of manipulation and the true market direction. This strategy demands precise structure reading and multi-step confirmations.
QML and MPL in RTM Style
In RTM, QML (Quasimodo Line) refers to the first peak or trough that includes a base candle, defining the inception of the QM structure.
MPL (Maximum Pain Level) is the second high or low formed afterward—where substantial amounts of liquidity are typically trapped. The primary price reaction usually occurs at the MPL, making it the ideal entry point.
Diamond Pattern in RTM
The Diamond Pattern in RTM is a complex reversal formation that integrates structure breaks, trader manipulation, and broken market expectations.
It often follows a QM pattern but differs in that the QM reaction point is engulfed, not respected. Price then extends beyond it.
How the Diamond Pattern Works?
Price reacts to a supply/demand zone, attracting entries, but then engulfs the zone, absorbing liquidity. It then abruptly reverses, breaks established trendlines, and initiates the main reversal move. Its symmetrical structure gives it a diamond-like appearance, making it one of the most deceptive and powerful reversal setups in RTM.
Conclusion
RTM Style offers a robust methodology for analyzing price behavior around key zones by meticulously examining market structure, order flow, and liquidity. Its fundamental focus is on identifying high-probability entry and exit points derived from the inherent logic of price movement.
By leveraging structures such as RBR, DBR, DBD, and RBD, analyzing untouched zones, evaluating candle types, and recognizing structure breaks, RTM facilitates a precise and nuanced interpretation of market dynamics.