TP & SL Tool: Risk Reward Ratio Calculator RRR MT4 | Prop Firm Protector: Trade Assist Prop Firm Plus TF Expert MT4 | Money Management + DrawDown Protector: Trade Panel Prop Firm Drawdawn Limiter Pro MT4 |Get a free Expert Advisor license via Telegram and WhatsApp
Advantages and Disadvantages of Using Momentum in Trading
Understanding the nuances of momentum is vital for effective trading strategies.
Advantages:
- Identifies strong market trends: Momentum indicators help pinpoint periods where price movements are robust and likely to continue.
- Spots potential reversal points: By analyzing shifts in momentum, traders can anticipate trend reversals before they fully materialize.
- Suitable for short and medium-term strategies: Momentum analysis is particularly effective for traders operating within these timeframes.
Disadvantages:
- Less effective in range-bound or sideways markets: Momentum signals can be unreliable when prices are consolidating without a clear direction.
- Generates false signals in short-term timeframes: Rapid price fluctuations can lead to misleading momentum readings.
- Requires combination with other tools: To enhance accuracy and reduce errors, momentum analysis should be integrated with other technical indicators.
The Importance and Applications of Momentum in Market Analysis
Momentum analysis assesses whether the underlying supply and demand dynamics in the market are sufficient to sustain the current price trend.
- Positive momentum indicates high demand and intense buying pressure.
- Negative momentum signals increased supply and strong selling pressure.
Key applications of momentum in market analysis include:
- Entering trades in the direction of a strong trend: Capitalizing on established momentum can lead to profitable trades.
- Identifying trend weakness: A decline in momentum can suggest that a trend is losing steam.
- Spotting divergences to predict trend reversals: Discrepancies between price action and momentum often foreshadow a change in trend direction.
- Recognizing overbought or oversold conditions: Momentum indicators help identify when an asset's price has moved too far too fast, suggesting a potential pullback.
Popular Momentum Indicators in Technical Analysis
Several widely used tools measure market momentum, each with unique algorithms and formulas.
Relative Strength Index (RSI)
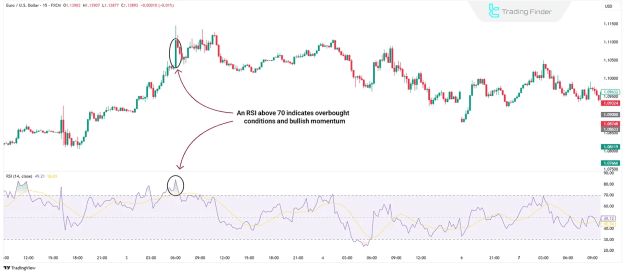
The Relative Strength Index (RSI) is a prominent momentum oscillator. It provides a value between 0 and 100, where:
- Levels below 30 typically indicate oversold conditions.
- Levels above 70 suggest overbought conditions.
Furthermore, divergences between RSI and price action can signal potential trend changes.
MACD Indicator
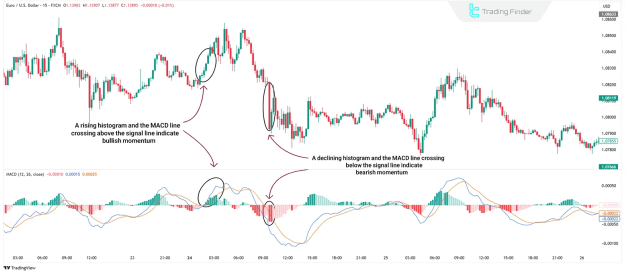
The Moving Average Convergence Divergence (MACD) indicator calculates the difference between two exponential moving averages.
- A cross of the MACD line over the signal line suggests strengthening momentum.
- A cross below the signal line indicates weakening momentum. The MACD histogram visually represents the intensity of this momentum.
Momentum Indicator
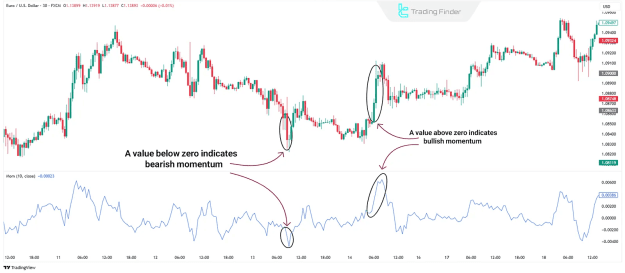
The Momentum Indicator directly illustrates the rate of price change.
- A value above zero signifies bullish momentum.
- A value below zero indicates bearish momentum.
Types of Momentum in Technical Analysis
Momentum can broadly be categorized into two primary types, each with distinct applications.
Confirmation Momentum
Confirmation momentum occurs when the movement of momentum indicators (such as RSI, MACD, or the Momentum Oscillator) aligns with the current price trend. This alignment provides traders with increased confidence that the prevailing trend is strong and likely to persist.
Contrary Momentum
Contrary momentum arises from a discrepancy between price movement and the momentum indicator. In this scenario, price moves in one direction while the momentum indicator signals the opposite. This divergence often indicates a weakening trend and serves as a crucial warning for potential reversals.
Momentum Analysis as a Trend Predictor
One of the most significant features of momentum is its ability to predict changes in market trends. Often, a shift in momentum precedes a price entering a new bullish or bearish trend, which is why technical analysts pay close attention to divergences.
- Positive divergence: Occurs when the price makes a new low, but the momentum indicator forms a higher low. This pattern suggests weakening selling pressure and a possible trend reversal to the upside.
- Negative divergence: Characterized by the price making a new high, while the momentum indicator forms a lower high. This typically indicates the end of an uptrend.
Forms of Momentum Candles
Momentum can manifest as bullish, bearish, or neutral, each reflecting distinct market conditions.
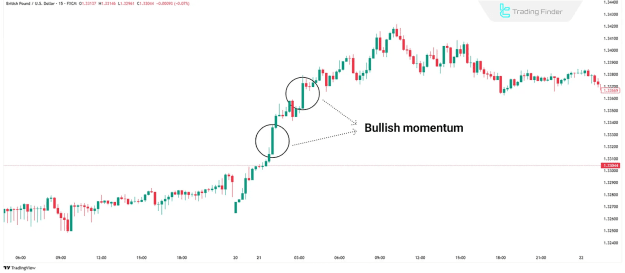
Bullish Momentum
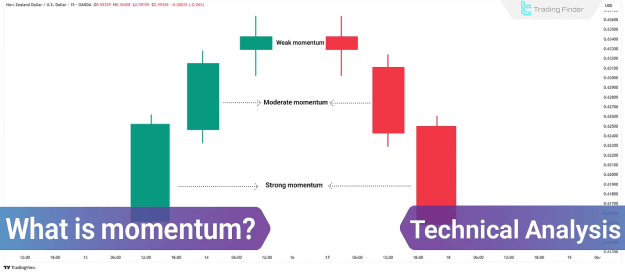
Bullish momentum is present when prices consistently rise and the rate of increase accelerates, signifying strong buyer power.
- Prices regularly form higher highs and higher lows.
- Indicators like RSI or MACD in overbought zones suggest a strong uptrend.
- This situation often signals a robust bull market and the likelihood of a continuing uptrend.
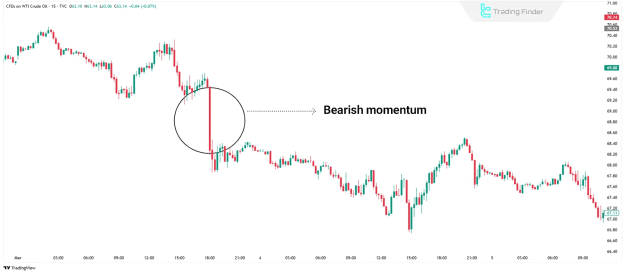
Bearish Momentum
Bearish momentum occurs when prices consistently fall and the rate of decline accelerates, reflecting strong seller power.
- Prices consistently form lower lows and lower highs.
- Indicators like RSI or MACD in oversold zones suggest a strong downtrend.
- This situation often signals intense selling pressure and a likely continuation of the downtrend.
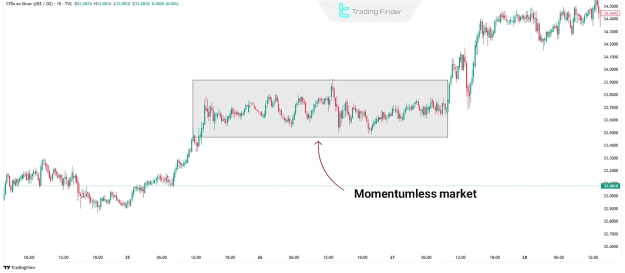
Without Momentum (Neutral)
A market exhibits neutral momentum when prices move sideways for an extended period without a clear directional bias. In this state, neither buyers nor sellers dominate.
- Prices move within a horizontal band or a limited range, failing to form new highs or lows.
- Indicators do not show a clear trend and tend to remain in their mid-zones.
- This reflects a state of indecision between market participants.
How to Find an Exit Point Using Momentum
Momentum analysis can be instrumental in identifying optimal exit points for trades.
- Declining momentum or divergence: If momentum declines or shows divergence from the price trend, it can signal an opportune time to exit a trade. For example, if a trader has entered a long position in an uptrend and momentum starts to drop, it may be prudent to close the trade and secure profits.
- Weakening momentum in downtrends: Similarly, if a trader is short in a downtrend and momentum weakens, it signals a good time to close the trade to prevent further losses or lock in gains.
Conclusion
Momentum is a foundational principle in technical analysis that critically assesses the strength of price movements. This indicator is invaluable for predicting potential trend changes and understanding market dynamics. However, for comprehensive analysis and improved accuracy, momentum analysis should always be combined with other factors such as price action, trading volume, and key support and resistance levels.