TP & SL Tool: Risk Reward Ratio Calculator RRR MT5 | Prop Firm Protector: Trade Assist Prop Firm Plus TF Expert MT5 | Money Management + DrawDown Protector: Trade Panel Prop Firm Drawdawn Limiter Pro MT5 |Get a free Expert Advisor license via Telegram and WhatsApp
What is Fibonacci in Financial Markets?
Fibonacci in financial markets refers to a collection of mathematical ratios derived from the renowned Fibonacci sequence. These ratios are applied to price charts as horizontal lines or via specialized tools to identify potential areas for price reversal or continuation. Traders leverage Fibonacci levels to pinpoint support and resistance zones, as well as price targets during both uptrends and downtrends. The core application of Fibonacci in technical analysis is to forecast pivotal price behavior changes based on the market's inherent wave structure.
History of Fibonacci
The Fibonacci sequence was first introduced by the Italian mathematician Leonardo Fibonacci in the 13th century within his seminal work, "Liber Abaci." In this sequence, each number is the sum of the two preceding numbers (e.g., 0, 1, 1, 2, 3, 5, 8, 13...). These sequences are observed across various natural phenomena, in art, and notably, in the technical analysis of financial markets.
The Use of Fibonacci in Technical Analysis
Fibonacci tools in technical analysis enable the prediction of market behavior based on recurring mathematical ratios. These tools are not solely employed for identifying support and resistance levels but also for:
- Setting price targets
- Identifying pullback points
- Detecting the culmination of major market movements
- Facilitating risk management planning
Fibonacci Numbers in Technical Analysis
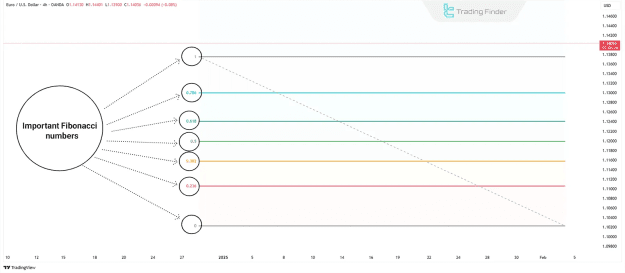
The Fibonacci sequence is a series where each number is the sum of the two preceding ones (0, 1, 1, 2, 3, 5, 8, 13, ...). The most crucial application of this sequence involves extracting key ratios such as 23.6%, 38.2%, 50%, 61.8%, and 78.6%. Within technical analysis, these specific ratios are utilized to identify potential reversal points, support, resistance, and price targets. The 61.8% ratio, also known as the golden ratio, holds particular significance in determining price reaction levels. By applying these numbers and ratios, traders can analyze price movements using various Fibonacci tools on the chart, pinpointing critical market areas.
Why Does Price React to Fibonacci Levels?
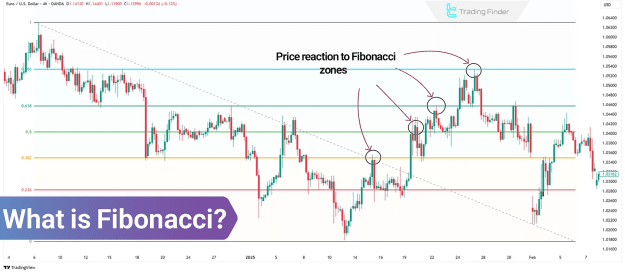
The reason prices often react to Fibonacci levels is due to the collective attention these levels receive from a large number of traders. The more widely followed these levels are, the higher the probability of a noticeable price reaction in those areas. While not every reaction is guaranteed, as other market factors also play a role, this widespread collective attention frequently leads to discernible price responses at these levels.
Types of Fibonacci Tools in Technical Analysis
Analytical platforms offer diverse tools based on the Fibonacci sequence and ratios, each serving a distinct purpose. The most prominent tools include:
- Fibonacci Retracement
- Fibonacci Extension
- Fibonacci Fan
- Fibonacci Arc
- Fibonacci Channel
- Fibonacci Time Zones
Fibonacci Retracement
The Fibonacci Retracement tool is utilized to identify levels where price movements may pause or reverse after an initial upward or downward trend. These lines indicate zones where the price has historically reacted or is likely to react again. By integrating these levels with other market data, traders can better assess probable price behavior.
How to Draw Fibonacci Retracement?
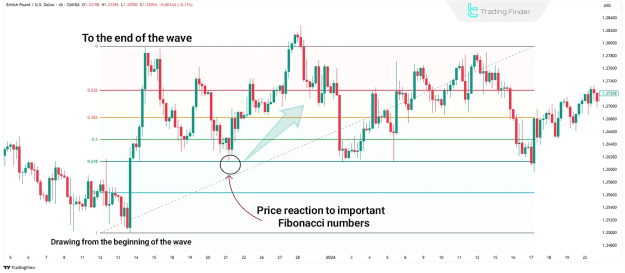
To draw this tool, a significant price wave (either a low to high or high to low swing) is typically selected on the chart. Fibonacci retracement lines are then plotted between these two points based on the 23.6%, 38.2%, 50%, 61.8%, and 78.6% ratios.
Fibonacci Extension
Fibonacci Extension is employed to determine price targets following the continuation of a trend, typically after a pullback or correction has concluded. These levels indicate where the price might advance after a corrective move, serving as potential profit-taking targets or probable market reaction zones.
How to Draw Fibonacci Extension?
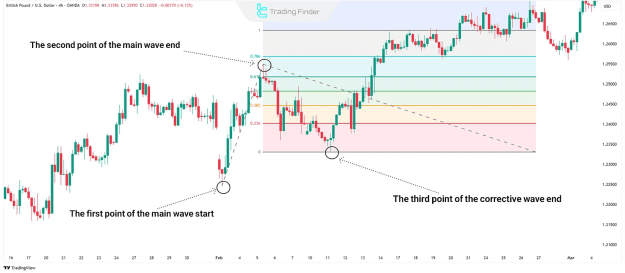
The trader selects three points – the start of the main wave, the end of the main wave, and the end of the correction – to plot the tool. This displays Fibonacci Extension levels such as 127.2%, 161.8%, 261.8%, and 423.6% on the chart.
Fibonacci Fan
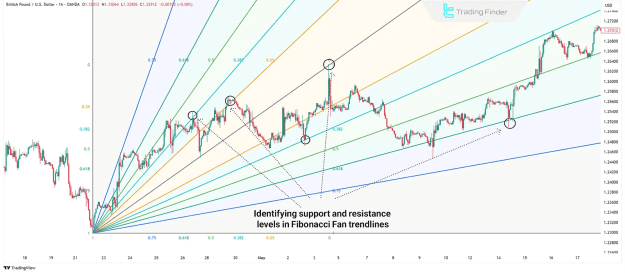
The Fibonacci Fan is a tool that draws diagonal lines based on Fibonacci ratios from a significant low or high point. These lines are used to examine dynamic support and resistance levels over time, aiding analysts in evaluating the trend's momentum and direction.
How to Draw Fibonacci Fan?
The analyst marks the low and high of a price wave, then uses the fan tool to draw diagonal lines from the low to the high (or vice versa) based on Fibonacci ratios.
Fibonacci Arc
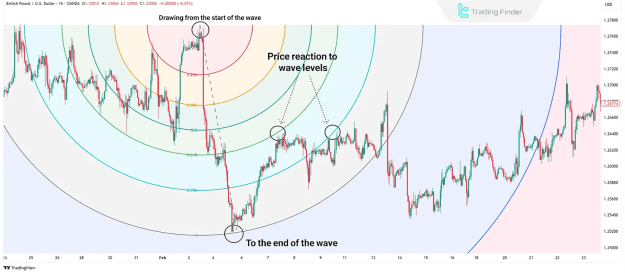
Fibonacci Arc creates arcs based on Fibonacci ratios originating from a primary price movement. These arcs suggest areas where the price may react as it progresses, often considered as combined support and resistance zones.
How to Draw Fibonacci Arc?
The analyst selects a low and a high point, then applies the arc tool between these points, resulting in arcs drawn based on Fibonacci ratios.
Fibonacci Channel
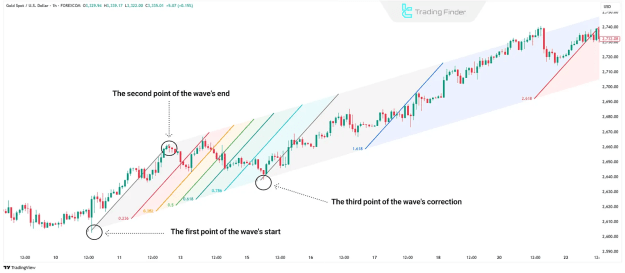
Fibonacci Channel plots parallel lines based on Fibonacci ratios along the main trend, delineating zones where support or resistance may occur. Traders utilize this tool to analyze price behavior within channel trends and identify suitable entry or exit points.
How to Draw Fibonacci Channel?
The analyst selects three points (typically two highs and one low, or vice versa) to draw parallel lines based on Fibonacci ratios in the direction of the main trend.
Fibonacci Time Zones
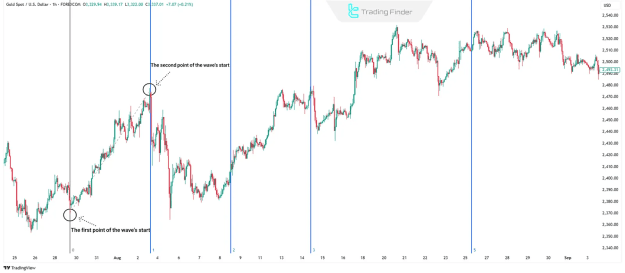
Fibonacci Time Zones are vertical lines drawn using the Fibonacci sequence from a significant price point into the future. These lines indicate potential times when trend changes or new price movements may emerge, primarily used to assess the temporal aspect of market moves, especially within larger trends.
How to Draw Fibonacci Time Zones?
The analyst identifies a starting and ending point for a trend, then uses the tool to draw vertical lines based on the Fibonacci sequence from the starting point into the future.
Additional Tips for Using Fibonacci Tools
For effective utilization of Fibonacci tools in trading, consider the following:
- It is advisable to apply Fibonacci only to clear, well-defined moves and strong trends.
- Fibonacci levels can be combined with other technical tools such as price action, candlestick patterns, indicators, and trading volume for more reliable signals.
- Always look for Fibonacci clusters – areas where multiple Fibonacci levels from different tools or timeframes converge, as these points are often particularly significant.
- Fibonacci should not be the sole decision-making tool; attention to market psychology and capital management is also crucial.
Combining Fibonacci with the RSI Indicator
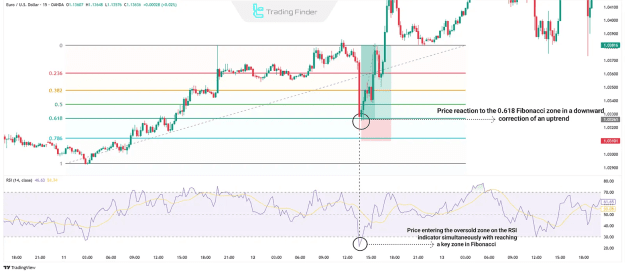
Integrating Fibonacci levels with the RSI indicator enhances the accuracy of trading signals. When the price approaches a key Fibonacci level and, concurrently, the RSI enters the overbought or oversold zone, this confluence significantly increases the probability of a price reaction or reversal. Traders employ this combination to better identify entry and exit points and mitigate trading risk.
Example of Combining RSI with Fibonacci
On a 15-minute EUR/USD chart, following a bearish correction within an uptrend, the price reaches the pivotal 0.618 Fibonacci level. Simultaneously, the RSI indicator signals that the price has entered the oversold area. In such scenarios, traders may consider entering a buy position.
Combining Fibonacci with Price Action
In this combined approach, the trader first plots important Fibonacci levels and then observes price behavior, looking for support/resistance reactions and candlestick patterns near these levels. If a price action reversal signal is observed in conjunction with a Fibonacci level, that signal is considered more robust and valid.
Example of Combining Fibonacci with Price Action
On the GBP/USD chart, the price reaches the key 0.618 Fibonacci level. At the same time, the price touches a 5-minute trendline, and a bullish engulfing candlestick pattern forms. These conditions are typically considered a suitable signal to initiate a trade.
Common Mistakes in Using Fibonacci
Common pitfalls when using Fibonacci in technical analysis include:
- Drawing Fibonacci levels in unclear or choppy trends.
- Incorrectly identifying swing highs and swing lows.
- Excessive reliance on Fibonacci while neglecting other analytical tools.
- Disregarding the need for trade confirmations.
- Ignoring broader market psychology and news events.
Using Fibonacci in Multi-Timeframe Analysis
Multi-timeframe analysis is an effective method for enhancing the accuracy and reliability of Fibonacci levels. In this approach, traders first plot Fibonacci levels on higher timeframes (e.g., daily or weekly charts) to identify major support and resistance areas. Subsequently, the same process is applied to lower timeframes (e.g., 4-hour or hourly charts).
Conclusion
Fibonacci tools, owing to their simplicity and adaptability for combination with other analytical methods, constitute an indispensable component of technical analysis. They are widely used for identifying reversal points, setting price targets, and implementing risk management. Their highest effectiveness is observed when evaluated in conjunction with trading volume, trend type, price action, and confirmations from indicators or candlestick patterns. Analyzing Fibonacci in multiple timeframes further augments the reliability of these levels.