TP & SL Tool: Risk Reward Ratio Calculator RRR MT5 | Prop Firm Protector: Trade Assist Prop Firm Plus TF Expert MT5 | Money Management + DrawDown Protector: Trade Panel Prop Firm Drawdawn Limiter Pro MT5 |Get a free Expert Advisor license via Telegram and WhatsApp
What Are Support and Resistance Levels?
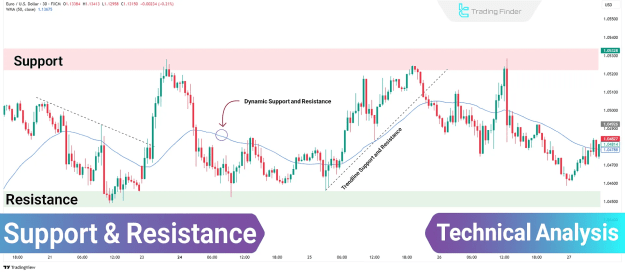
Support refers to a price level where a downtrend is expected to halt due to a concentration of buying demand. Essentially, it's a point where buying interest is anticipated to overcome selling pressure.
Conversely, resistance is a price level where an uptrend may stall or reverse as selling pressure outweighs buying interest.
Types of Support and Resistance
In technical analysis, support and resistance are not merely simple lines but manifest in diverse forms based on market behavior:
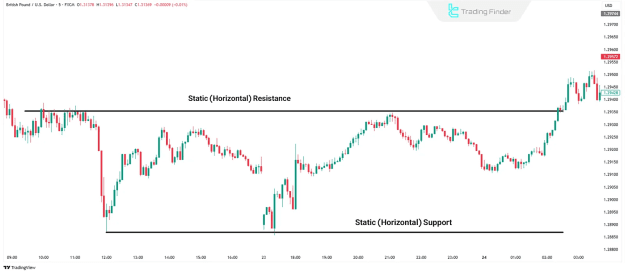
- Static (Horizontal) Support and Resistance: Formed when the price repeatedly reacts to a specific horizontal level. These are typically depicted as straight lines on charts.
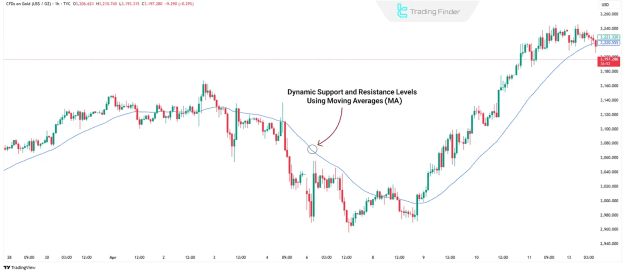
- Dynamic Support and Resistance: Calculated using technical indicators like Moving Averages (MA), such as the 50-period MA or the 200-period MA. These levels adapt to price movements and are particularly effective in trending markets.
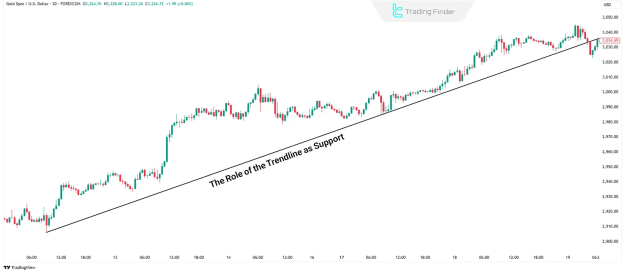
- Trendline-Based Support and Resistance: During an uptrend or downtrend, the trendline itself serves as support or resistance. In an uptrend, the trendline beneath the price acts as support, while in a downtrend, the trendline above the price functions as resistance.
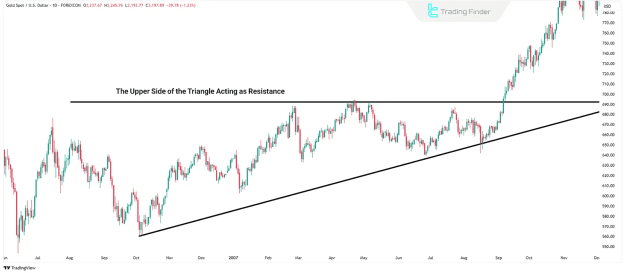
- Pattern-Based Support and Resistance: Classical chart patterns like triangles, channels, and flags inherently create support or resistance. For example, the upper boundary of an ascending triangle can act as resistance.
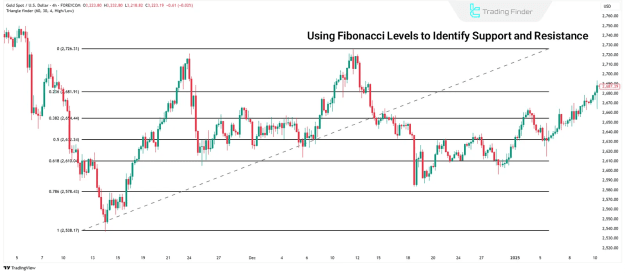
- Fibonacci Levels: Fibonacci retracement tools are crucial for identifying potential reversal zones. Key Fibonacci levels such as 38.2%, 50%, and 61.8% frequently serve as strong support or resistance.
- Psychological Support and Resistance: These are often round numbers (e.g., 1.2000 in Forex or 60,000 in Bitcoin) that attract significant attention from traders and institutions. They frequently trigger strong market reactions due to concentrated order flow and prevailing trader sentiment.
Role Reversal of Support and Resistance
A critical concept in technical analysis is the role reversal of these levels:
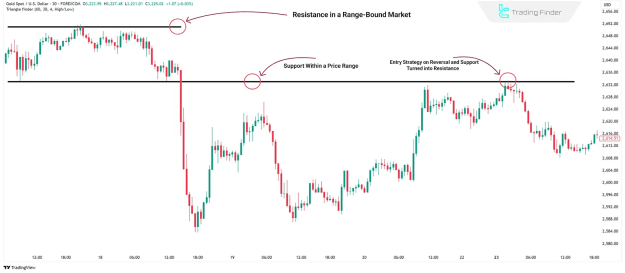
- If the price breaks below a support level, that former support often transforms into new resistance.
- If the price breaks above a resistance level, that former resistance may subsequently act as new support.
The reliability of these levels increases with the number of times the price touches and reacts to them. These zones function as psychological triggers, prompting market participants to take action.
Support and Resistance Trading Strategies
The following strategies can be employed for trading using support and resistance levels:
- Reversal Entry Strategy: In this method, a trader enters a position when the price reaches a significant support or resistance level and shows clear signs of reversal. This approach typically involves lower risk, with stop-losses strategically placed near the reversal point.
- Range Trading Strategy: This strategy is executed when the price oscillates between well-defined support and resistance levels. Traders aim to buy at support and sell at resistance within a horizontal or neutral trend.
- Breakout Strategy: This strategy is implemented when the price decisively breaks through a key support or resistance level. A valid breakout is typically confirmed by an increase in trading volume. Often, the price will return to retest the broken level (a pullback) before continuing its movement in the direction of the breakout.
Conclusion
Support and resistance levels are indispensable tools for forecasting price behavior in financial markets. They effectively signal areas where trends may pause, reverse, or gain momentum. Once broken, these critical levels can reverse their roles, presenting actionable opportunities for various trading strategies, including breakout, range, and trendline approaches.