TP & SL Tool: Risk Reward Ratio Calculator RRR MT4 | Prop Firm Protector: Trade Assist Prop Firm Plus TF Expert MT4 | Money Management + DrawDown Protector: Trade Panel Prop Firm Drawdawn Limiter Pro MT4 |Get a free Expert Advisor license via Telegram and WhatsApp
Advantages and Disadvantages of Moving Averages
Moving Averages, while powerful, come with their own set of pros and cons:
Advantages:
- Simplicity and Ease of Understanding: MAs are straightforward to calculate and interpret, making them accessible to traders of all experience levels.
- Noise Reduction: They effectively reduce the impact of short-term price volatility, allowing traders to focus on the broader trend.
- Versatility in Timeframes: MAs can be applied across different timeframes, enabling more comprehensive and accurate analysis depending on the trading strategy.
Disadvantages:
- False Signals in Range-Bound Markets: In markets without a clear trend (i.e., range-bound or consolidating markets), MAs can generate misleading signals.
- Lagging Indicator: MAs are inherently lagging indicators, meaning they reflect past price action and may not identify market turning points immediately.
- Delayed Response: Due to their lagging nature, MAs provide a delayed response to significant price changes, potentially causing missed early entry or exit opportunities.
Types of Moving Averages
There are two primary types of Moving Averages widely used in technical analysis:
- Simple Moving Average (SMA)
- Exponential Moving Average (EMA)
Simple Moving Average (SMA)
The Simple Moving Average (SMA) is calculated by summing the closing prices of an asset over a specified period and dividing the total by the number of periods. For instance, a 50-period SMA is the sum of the closing prices over the past 50 days, divided by 50. Each day, the oldest data point is dropped, and the newest is added, creating a "moving" average.
Exponential Moving Average (EMA)
The Exponential Moving Average (EMA) places greater emphasis on more recent price data, making it more responsive to current market changes compared to the SMA. This responsiveness makes the EMA particularly favored by short-term traders and scalpers.
Differences Between Simple and Exponential Moving Averages (SMA & EMA)
The key distinctions between SMA and EMA are as follows:
- Sensitivity to New Prices: EMA is more sensitive to new price information, while SMA is less so.
- Signal Delay: SMA exhibits a greater signal delay due to its equal weighting of all data points, whereas EMA has less delay because it prioritizes recent prices.
- Appropriate Time Frame: SMA is generally preferred for long-term trend analysis due to its smoother nature. EMA, with its quicker reaction time, is more suitable for short-term trading and scalping strategies.
Appropriate Time Frames for Moving Averages
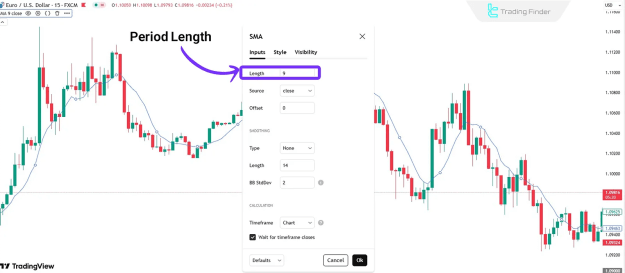
Selecting the correct period length is crucial for the effective application of Moving Averages. The period length refers to the number of candles or data points used in the average calculation.
Period Length in Moving Averages (MA)
- Short-term Moving Averages (e.g., 10 or 20 periods) react rapidly to price fluctuations, making them useful for capturing immediate market shifts.
- Long-term Moving Averages (e.g., 50 or 200 periods) are smoother and provide a better representation of overarching, long-term trends.
The choice of timeframe should always align with an individual's trading style. Short-term traders typically find faster MAs more beneficial, while long-term investors generally gain more insight from slower, smoother averages.
Applications of Moving Averages
Traders leverage Moving Averages for a variety of critical purposes in technical analysis:
Identifying Market Trend
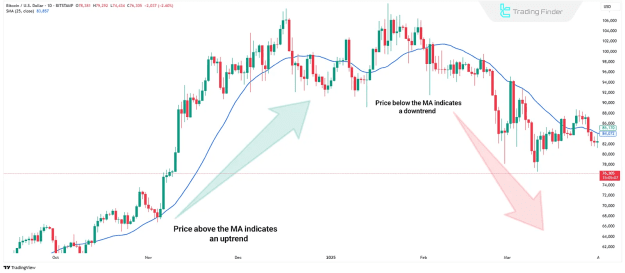
MAs are excellent for clearly identifying the prevailing market trend:
- If the asset's price is consistently above the Moving Average, it generally indicates a bullish market trend.
- Conversely, if the price remains consistently below the Moving Average, it suggests a bearish market trend.
Buy and Sell Signals (Moving Average Crossovers)
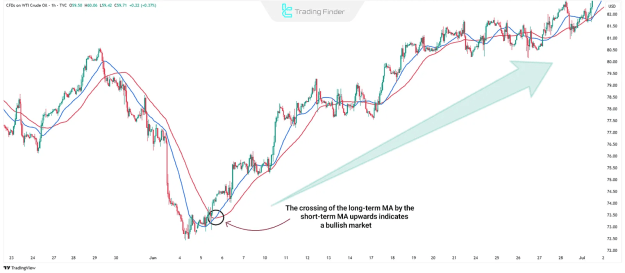
One of the most popular MA strategies involves Moving Average Crossovers:
- A buy signal is generated when a shorter-term MA crosses above a longer-term MA, indicating increasing bullish momentum.
- Conversely, a sell signal occurs when a shorter-term MA crosses below a longer-term MA, suggesting a shift towards bearish momentum.
Dynamic Support and Resistance Levels
In trending markets, Moving Averages often serve as dynamic support or resistance levels:
- In an uptrend, the MA can act as a support level, where prices tend to bounce off before continuing higher.
- In a downtrend, the MA can act as a resistance level, where prices struggle to break above.
Multi-Timeframe Analysis Using MAs
Analyzing MAs across multiple timeframes can provide a more comprehensive market perspective:
- For example, if the price is above the MA in a larger timeframe but temporarily below the MA in a smaller timeframe, it could signal a short-term correction within a broader uptrend, potentially presenting a buying opportunity at a more favorable price.
Conclusion
Moving Averages (MA) are deceptively simple yet remarkably powerful tools within the realm of financial market technical analysis. By calculating the average price over various timeframes, they effectively filter out short-term market noise, enabling traders to accurately identify and capitalize on the primary market trend. Beyond mere trend identification, MAs are integral to advanced trading strategies, including crossover signals, the establishment of dynamic support and resistance levels, and insightful multi-timeframe analysis