TP & SL Tool: Risk Reward Ratio Calculator RRR MT5 | Prop Firm Protector: Trade Assist Prop Firm Plus TF Expert MT5 | Money Management + DrawDown Protector: Trade Panel Prop Firm Drawdawn Limiter Pro MT5 |Get a free Expert Advisor license via Telegram and WhatsApp
What Is a Pullback?
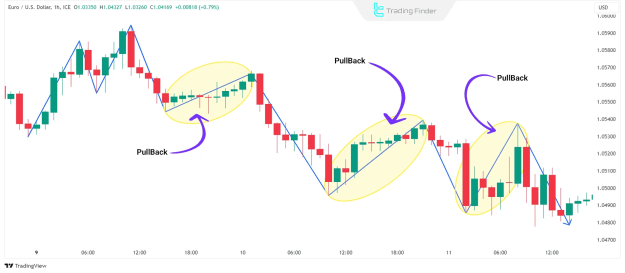
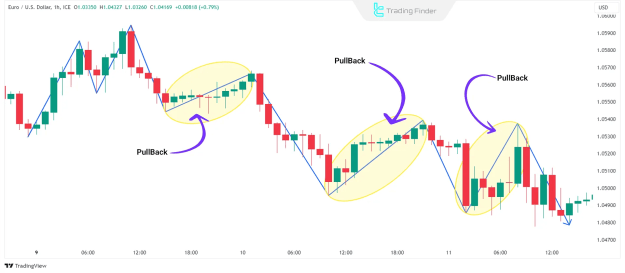
A pullback signifies a temporary counter-trend price movement within an established trend. For instance, in an uptrend, the price might reach a new temporary high, experience a slight decline, and then resume its upward trajectory.
- Pullbacks are typically characterized by lower trading volume, indicating a lack of strong conviction from market participants to sustain the counter-trend move.
- Crucially, pullbacks do not break key support or resistance levels that define the prevailing trend, distinguishing them from reversals.
- Traders often perceive pullbacks as opportunities to enter trades at more favorable prices, allowing them to capitalize on the overall trend.
Consider a scenario in the EUR/USD 1-hour chart where prices decline in an uptrend before continuing higher – this exemplifies a classic pullback. Similarly, a price correction in a downtrend before further downward movement also constitutes a pullback.
What Is a Reversal?
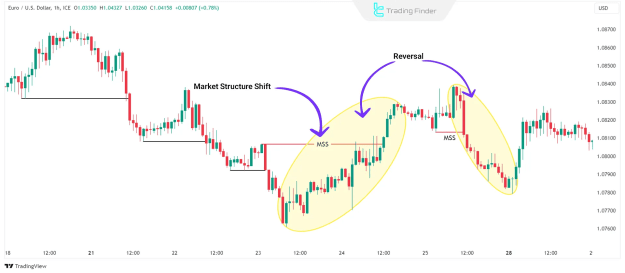
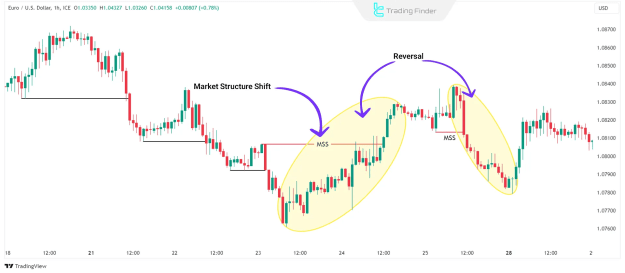
Conversely, a reversal denotes a fundamental and significant shift in the prevailing market direction. This occurs when an existing uptrend definitively transitions into a downtrend, or vice versa.
- Identifying reversals is critical for traders as they signal a shift in market sentiment and the emergence of entirely new trading opportunities, often in the opposite direction of the prior trend.
An example of a reversal would be a sharp price reversal in the EUR/USD 1-hour chart, where an uptrend definitively transforms into a downtrend, or a clear price reversal from a downtrend to an uptrend.
Differences Between a Reversal vs. Pullback
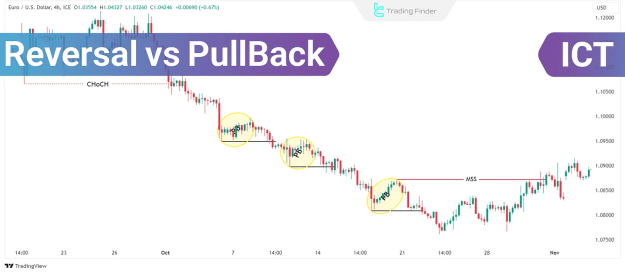
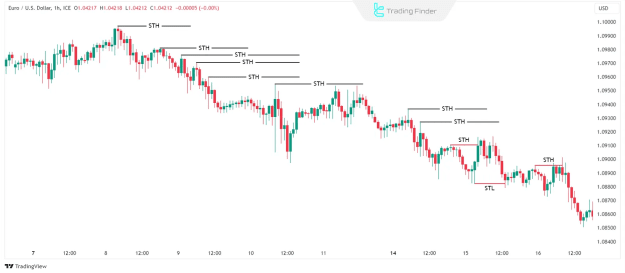
Distinguishing between reversals and pullbacks effectively involves a multifaceted approach, integrating market structure with the identification of short-term highs (STH) and lows (STL).
- Using Trendlines: Drawing trendlines connecting successive short-term highs and lows offers a visual representation of the market's underlying structure. A break of a significant trendline can signal a potential reversal.
- Watching for Breakouts: Monitoring for breakouts above recent highs or below recent lows is essential. A confirmed breakout can indicate a potential reversal, while the failure of price to break key levels suggests a continuation of the existing trend (a pullback).
- Volume Analysis: A surge in trading volume accompanying a breakout often confirms the strength and validity of a potential reversal. Conversely, low volume during a counter-trend move is more indicative of a weak pullback.
Identifying Short-Term Highs and Lows
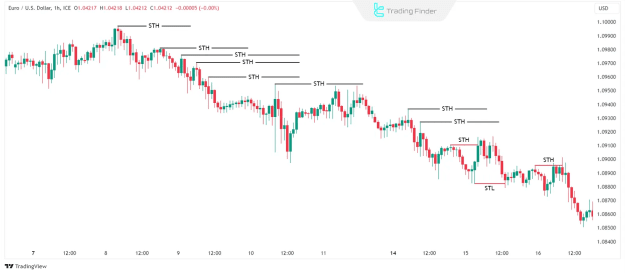
A highly effective technique for differentiating between reversals and pullbacks is to meticulously mark short-term highs (STH) and lows (STL).
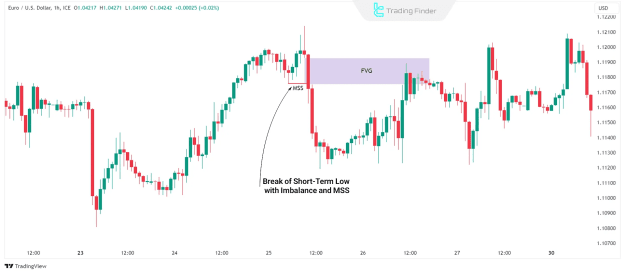
- In an uptrend, a reversal is confirmed when the price breaks decisively below a prior short-term low (MSS - Market Structure Shift).
- If the short-term low remains intact, the price correction is classified as a pullback, indicating that the prevailing trend is likely to continue.
- In a downtrend, the opposite applies: a reversal occurs when a prior short-term high is broken.
Recognizing Market Imbalances
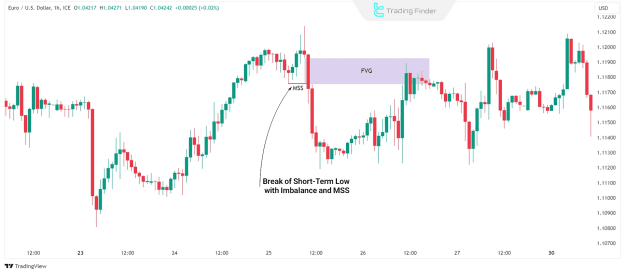
Market imbalances, such as Fair Value Gaps (FVG), frequently emerge when structural changes in the market coincide with significant supply and demand discrepancies.
- These imbalances often serve as powerful indicators, signaling the beginning of trend reversals.
- Understanding and analyzing these imbalances empowers traders to identify critical market turning points and accurately differentiate between a pullback and a reversal.
- Conditions characterized by sharp price changes, increased trading volume, and noticeable unbalanced market zones often precede or accompany such imbalances. A price reversal with imbalance often occurs after breaking a short-term low (STL), marking a clear market structure shift with FVG.
Significance of Higher Timeframes in Identifying Pullbacks and Reversals
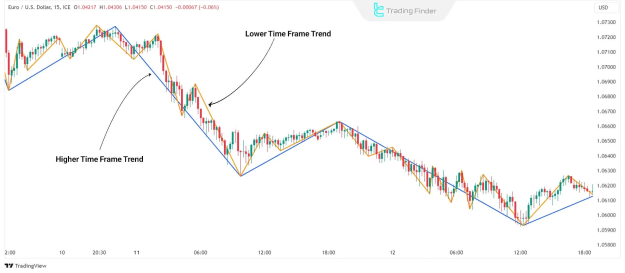
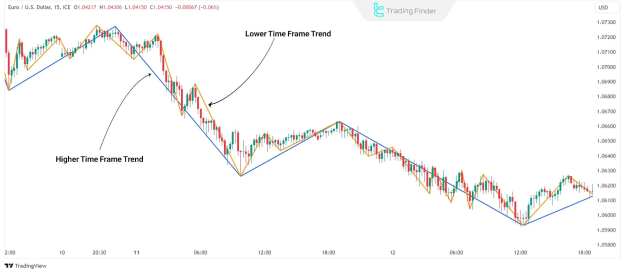
When analyzing market structure, higher timeframes offer a clearer and less cluttered perspective of market trends. They are instrumental in accurately identifying both pullbacks and reversals.
- For example, in a dominant uptrend on the daily chart, the 4-hour chart might display pullbacks that present ideal entry points in the direction of the main trend. This multi-timeframe analysis helps traders avoid entering trades against the prevailing dominant trend.
- Higher timeframes effectively smooth out short-term price fluctuations, allowing traders to focus on the overall trend and filter out market noise.
How to Use Higher Timeframes Effectively
To maximize the benefits of higher timeframes, it's crucial to align them with lower timeframes and gain a comprehensive understanding of the overall market trend.
- Identify the Main Trend: Always utilize higher timeframes to definitively identify the overarching market trend. This foundational understanding is crucial for distinguishing between genuine pullbacks and impending reversals.
- Mark Key Levels: Identify significant support and resistance levels on higher timeframes. These levels often act as potential entry or exit points, and their breach can signal a reversal.
- Look for Confluence: Analyze multiple timeframes for confluence. For instance, a 15-minute pullback occurring within a strong bullish daily trend can signal a high-probability buy opportunity, confirming the strength of the main trend.
Conclusion
For both Forex and crypto traders, a profound understanding of the distinction between a reversal and a pullback is fundamental to successful trading. By effectively employing market structure analysis, leveraging higher timeframes, accurately identifying short-term highs and lows, and diligently detecting market imbalances, traders can significantly refine their trading strategies and make more informed, profitable decisions.