• Home
  • Forums
  • News
  • Calendar
  • Market
  • Login
  • Join
  • User/Email: Password:
  • 4:00am
Menu
  • Forums
  • News
  • Calendar
  • Market
  • Login
  • Join
  • 4:00am
Sister Sites
  • Energy EXCH
  • Crypto Craft
  • Forex Factory

Options

Bookmark Thread

First Page First Unread Last Page Last Post

Print Thread

Similar Threads

Broker Challenge "NDD/STP" vs. True "ECN" and "Mkt Mkr" broker talk 46 replies

"Price - Structure - Flow" 1,489 replies

Dealing with "Invalid Price", "Requote", "Server Busy" in MT4 3 replies

MT4 Order Type: "Instant Execution" vs "Market Execution" 2 replies

Please help with "int start()" structure - I want to process bars left to right 5 replies

  • Trading Discussion
  • /
  • Reply to Thread
  • Subscribe
  • 9
Attachments: "Structure" of the market
Exit Attachments
Tags: "Structure" of the market
Cancel

"Structure" of the market

  • Last Post
  •  
  • Page 1 234 5
  • Page 1 234 5
  •  
  • Post #1
  • Quote
  • First Post: Mar 27, 2018 12:49pm Mar 27, 2018 12:49pm
  •  DonPato
  • Joined Dec 2015 | Status: Member | 1,509 Posts
Hello all...I've tried several times to stimulate some conversation around this topic. I don't know if it's too boring or if no one is really interested. But I am going to try one last time...HELL OF A WAY TO START A THREAD...

I would truly appreciate any and all points of view on the topic of the "structure" of the market...meaning how and why do you think the market actually functions? Further...knowing this, how does this knowledge assist you or facilitate your trading?

I ask this because I see many threads out there with many different "systems" using different mathematical probability formulas, that, when I look at them don't seem to take into account how the market actually works. Or in other words, how does that cute little line, or pattern, or indicator, or ___ (fill in the blank) tell you what the market is currently doing? What does it tell you about the market structure...I'm willing to bet that most of those things you put on your chart don't really tell you anything and in fact may cause or add to your confusion...I know they do for me.

Wouldn't it be advantageous to be able to look at a chart (how ever you have it configured) and deduce what the "structure" of the market is doing? And from that moment you might be able to recognize what (statistically/logically) might happen next? If you could do that...wouldn't that be the beginning of a true "edge"? Not based on some magic indicator or some imaginary line or some price pattern resembling a ghost, or a flag, but an actual (yes perhaps even intuitive) understanding of how the market works and thus how price will (in all probability) move in the near future.

I would like this to be the focus of this thread...tell me how YOU view the structure of the market and I will tell you how I view it...perhaps this exchange of ideas will stimulate us both into something we never considered before and improve our individual understanding and interaction with this grand machine we call, "the market".

I invite your participation
Do more of that which succeeds and less of that which does not - Dennis Gar
  • Post #2
  • Quote
  • Mar 27, 2018 12:59pm Mar 27, 2018 12:59pm
  •  DonPato
  • Joined Dec 2015 | Status: Member | 1,509 Posts
Ok...so I'll get the ball rolling. If any of you have read any of my previous threads (boring as they may be), you will know I am a big proponent of market structure and order flow. Further how these structural components result in the price bars you see on your chart.

In my understanding the markets (yes any and all markets) have four main structural components: Time, Order Flow, Volume, and Price. Each of these components is an integral, dynamic and indispensable part of the market. Without any of these four basic things, the market will cease to function or even exist at all. There is actually one more basic component, "open interest". While I feel that this too is integral to how the market works, I put it in more of a "contributory role" and not and indispensable one.

Again, I would eagerly await any comments you would have. Tell me what you think. Shall we explore these concepts together?
Do more of that which succeeds and less of that which does not - Dennis Gar
 
2
  • Post #3
  • Quote
  • Mar 27, 2018 1:19pm Mar 27, 2018 1:19pm
  •  DonPato
  • Joined Dec 2015 | Status: Member | 1,509 Posts
Lets start with TIME:

Why is time such and indispensable part of the market? What does TIME have to do with anything? TIME is just time...right? WRONG!

Time is fluid and dynamic...our charts (most of them at least) are divided into intervals of time, it takes time for one to look at or absorb any assessment you may make about any current market condition. It takes time to place an order and time for that order to be filled. Time is a key factor in news and fundamental announcements and the time it takes for the world to absorb and respond to any market condition is dynamic and fluid. Most importantly time is variable and a very important variable at that. Price movements may take a long time or a short time to complete...once completed, price movements may range or not, and all of that takes time to determine.

Yes time is extremely important and should be one of your first considerations when determining the current market conditions.

Lets take the example of a futures market, like corn. Lets say its the beginning of the growing season. Time is needed for that season to complete, thus the speculation regarding the output of that crop will vary widely throughout the season. What if there is a large crop planted? What if 1/2 way though the season, the crop is flooded? What if there is a drought? All of these things take place in the dynamic of time. Thus from one week to the next or from one day to the next, or even when bad news comes out, from one second to the next, price can vary substantially. This is dependent on the dynamic of time...

How about another example, this time the stock market? What happens if a major company has bad news to report? Do you think they will delay that report as long as possible? Is that not another dynamic of time? How about if it malfeasance is discovered? Do you think that traders will waste TIME in trying to adjust their positions?

Time is variable and dynamic
Do more of that which succeeds and less of that which does not - Dennis Gar
 
1
  • Post #4
  • Quote
  • Mar 27, 2018 1:24pm Mar 27, 2018 1:24pm
  •  DonPato
  • Joined Dec 2015 | Status: Member | 1,509 Posts
So how can we use that in our trading? How does it help us to know that TIME is fluid and dynamic?

Well how about this? What if you are in a position (let say a long) and while price is moving your way, it is doing so very slowly...and when it does go your way it doesn't go very far. In other words it is taking a LONG TIME for your position to move as you anticipated it might. Does speed surprise you? Or where you expecting it to take awhile? Was there a certain amount of time you anticipated your position to show results? Did that issue of time cause you to doubt the veracity of your position? Did you "bail out" thinking that, "...its just not happening"? Or perhaps did you think, "...just a little more patience." and then watch it all cave in?

TIME has a greater influence on your trading than you might think. Tell me what you think?
Do more of that which succeeds and less of that which does not - Dennis Gar
 
3
  • Post #5
  • Quote
  • Mar 27, 2018 6:18pm Mar 27, 2018 6:18pm
  •  hanover
  • Joined Sep 2006 | Status: ... | 8,092 Posts
Quoting DonPato
Disliked
Wouldn't it be advantageous to be able to look at a chart (how ever you have it configured) and deduce what the "structure" of the market is doing? And from that moment you might be able to recognize what (statistically/logically) might happen next? If you could do that...wouldn't that be the beginning of a true "edge"?
Ignored
Makes good sense to me.
 
 
  • Post #6
  • Quote
  • Mar 27, 2018 6:49pm Mar 27, 2018 6:49pm
  •  GEfx
  • Joined May 2009 | Status: Member | 3,449 Posts
Do you want to limit discussion to the 4 components you've listed? My view of market structure is quite different from yours.
 
 
  • Post #7
  • Quote
  • Mar 27, 2018 7:33pm Mar 27, 2018 7:33pm
  •  COGSx86
  • Joined Dec 2013 | Status: Member | 1,874 Posts
Quote
Disliked
Time, Order Flow, Volume, and Price

Deeper then that the market is.

Where does the volume come from. Who makes the Order flow? Time what time, time only is a reactionary measure to gauge the market. 1 min, 5 mins, 1 hour? Whose time? Time matters not, look at your clock, judge the market by your clock, do you? Well you should not. Banks creates it, make it grow. Its power surrounds us and binds us. You must understand why the money grows, banks, governments, forex, between you, me, this forum, your trading platform, everywhere.

Money grows and who controls the issue of money?

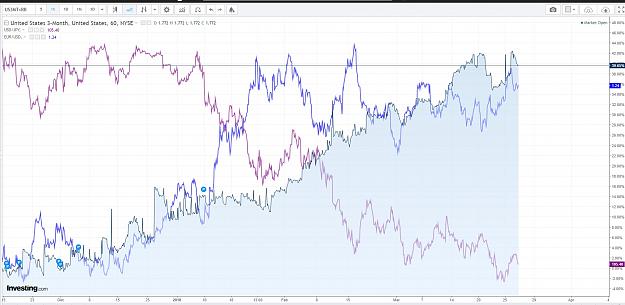
Let me ask, what do you see in this chart?
Attached Image (click to enlarge)
Click to Enlarge

Name: fed13.jpg
Size: 241 KB
Learn, a forex trader must, unlearn and relearn he will.
 
 
  • Post #8
  • Quote
  • Mar 27, 2018 8:02pm Mar 27, 2018 8:02pm
  •  Sossos
  • Joined Apr 2013 | Status: Member | 684 Posts
The majority of traders only measure with horizontal lines, boxes, rectangles, support and or resistance. One of the things not generally considered when applying an Andrews pitchfork or median line is that it is measuring an angle which can and does include time and price. It's a projection of time and price into the future. Having said that most people don't give a shit about time because there's no money in it. They just expect to take some time to get to their price to exit. Consequentially they really never study time.
I would say that having indicators on your chart obscures (like MA's) the view of the price action that is going on to make the indicator. Because those tools are all that's looked at, the study of the underlying structure gets shrouded and never is fully understood or appreciated. It is rare to see a trader say on these forum that the trend is going one way or the other because of higher highs and higher lows or lower lows and lower highs. It's usually because they are looking at the indicator to tell them. Then they don't have to make the distinction themselves or subconsciously they can blame the indicator. I mentioned a 4th pivot the other day and a trader asked me what I meant by that. I wasn't sure if he didn't know what a pivot (turn) was or that 4 comes after 3.
 
2
  • Post #9
  • Quote
  • Mar 27, 2018 9:42pm Mar 27, 2018 9:42pm
  •  tzamo
  • Joined Nov 2017 | Status: Member | 793 Posts
Quoting Sossos
Disliked
The majority of traders only measure with horizontal lines, boxes, rectangles, support and or resistance. One of the things not generally considered when applying an Andrews pitchfork or median line is that it is measuring an angle which can and does include time and price. It's a projection of time and price into the future. Having said that most people don't give a shit about time because there's no money in it. They just expect to take some time to get to their price to exit. Consequentially they really never study time. I would say that having...
Ignored
Dear DonPato, thanks for not giving up on getting a thread like this started. You make some really good points and I do understand your view to lead to the beginning of a true "edge". My view is that perhaps time on its own is meaningless, but when time is bound to another aspect it becomes a variable that can be manipulated to get different results. Anyone heard of the 'Iron Triangle' ? It has 3 points; TIME, COST and QUALITY and tries to demonstrate the relation ship between these 3 factors to get a product. This suggests that if I want to have quality price signals from a signal provider at fast speeds, I have to contribute a large amount of cost for the service. By signal, I mean the data tick of currency prices. Now, same with order flow, if you have lower quality (slower data) you will not have an edge. That is even if it is possible to get data for order flow with the forex market being not run by one central system for order management from my understanding.
So, long story short: Time by itself doesn't have much meaning unless you use it to measure something from point A to B, like volume of orders exectuted in Xseconds.

Sossos, the real issue with angle popularity is that the general platforms scaling is Sh1t if you use auto scale. This makes it very hard then to bother with angles as after some large price action, the new smaller bars are condensed so much. And give that other trader a break, as maybe you need to revisit how pivots can be communicated to others. Generally there is only 1 pivot and rest are labelled R1, R2 ,R3 and S1, S2, S3 and sooo on...And if in further doubt, Provide the other trade with a picture and circle what you mean and don't blame them for misunderstanding that the ways you learned how to explain pivots are different.
Kind Regards,
Tzamo
"Only you can Make the Future you will be proud to be a part of..." -Me
 
2
  • Post #10
  • Quote
  • Mar 27, 2018 9:48pm Mar 27, 2018 9:48pm
  •  4for4
  • | Joined Apr 2017 | Status: 38737526 / 29052019 | 1,245 Posts
Quoting DonPato
Disliked
... In my understanding the markets (yes any and all markets) have four main structural components: Time, Order Flow, Volume, and Price ...
Ignored
And all those components will blend into so-called “price-pattern” (or, some like to call it “price-action”) ...
All technical analysis methodologies are geared toward “studying” how those patterns behave. But, in the end, all those methodologies are really trying to find a “strong” resistance/support to be used as a reference for making a trading decision ...
Market is not random but unpredictable
 
 
  • Post #11
  • Quote
  • Mar 27, 2018 10:20pm Mar 27, 2018 10:20pm
  •  Sossos
  • Joined Apr 2013 | Status: Member | 684 Posts
A pivot, you know a simple turn in the market from down to up or up to down.

You're talking about pivot points which are derived from a mathematics equation that who? created. or H,L O or C.

The angle is a product of the speed of a market.

When you have a WRB (wide range bar). What happens after all that energy has been spent? What did the WRB beat ( stops taken out?)

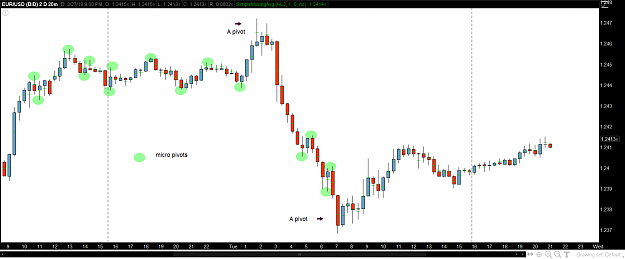
There are micro pivots, minor pivots and major pivots. Its a simple version of Elliott. All relative in size to one another. In this picture notice the similarities of size. ???? Does it mean something????One of the biggest things that humans always forget, is, What they don't know and how it impacts them and the ability to trade. Great traders make themselves great with one simple understanding. Even if someone tells them something they verify it themselves and in the process they see even more than the person that told them something. An un-quenched thirst for understanding of what the language of the chart is saying.
Attached Image (click to enlarge)
Click to Enlarge

Name: FF share 2.png
Size: 44 KB
 
 
  • Post #12
  • Quote
  • Mar 27, 2018 10:25pm Mar 27, 2018 10:25pm
  •  DonPato
  • Joined Dec 2015 | Status: Member | 1,509 Posts
Hello again friends...thanks for these really great comments. I will try to comment in response to as many as I have a cogent response. First of all, TIME is only one element of the market and as COGSx86 correctly points out, it means different things to different traders. As well as tzamo points out that time is a key element in finding a good data feed. Why do you think that HFT have their servers as close to the exchange as physically possible? Because those fractions of seconds count in profit or loss.

4for4 points out that TIME in combination with other structural components create the "price action" signals many here use to trade. But isn't that just the point? TIME in combination with ORDER FLOW, and VOLUME create price movements and their resulting patterns. Thus by studying and understanding the basal structural components we can create the "edge" we are looking for which would then allow us the insight to "Know" which of those price patterns is really going to create "support" or "resistance" or "demand" and "supply"...

Please don't misunderstand me. I am not nor do I wish to sound as though I am belittling any technical analysis technique that you may or may not be using. I think most have some valid application...the real question to know is WHEN are they most helpful...and the question of WHEN is also an issue of time. Clearly trending indicators have valid application in trending markets but ultimately fail when a range ensues...and vise versa...oscillating indicators are superior in ranging conditions but create "false" signals during trending markets.

Isn't it a better idea to think about WHAT is causing or creating a certain condition instead of trying to tweek your latest "gee whiz look at that" indicator.

Pivot points are yet another mathematical formula based on YESTERDAY, but that creates a "reference" point to know WHERE (what price) one might see a change in conditions...but what change? Could it be perhaps, a change in "order flow". And doesn't that reference point also give you some idea of TIME in your trading..."Do I want to go short now?" "Not yet, what for price to reach x level and then lets see."

Aren't these all issues of TIME? Why DO we call it "timing the market".

WHEN to trade is just as important (if not more important) than WHERE to trade (IMHO).
Do more of that which succeeds and less of that which does not - Dennis Gar
 
1
  • Post #13
  • Quote
  • Mar 27, 2018 10:36pm Mar 27, 2018 10:36pm
  •  DonPato
  • Joined Dec 2015 | Status: Member | 1,509 Posts
Quoting Sossos
Disliked
A pivot, you know a simple turn in the market from down to up or up to down. You're talking about pivot points which are derived from a mathematics equation that who? created. or H,L O or C. The angle is a product of the speed of a market. When you have a WRB (wide range bar). What happens after all that energy has been spent? What did the WRB beat ( stops taken out?) There are micro pivots, minor pivots and major pivots. Its a simple version of Elliott. All relative in size to one another. In this picture notice the similarities of size. ???? Does...
Ignored
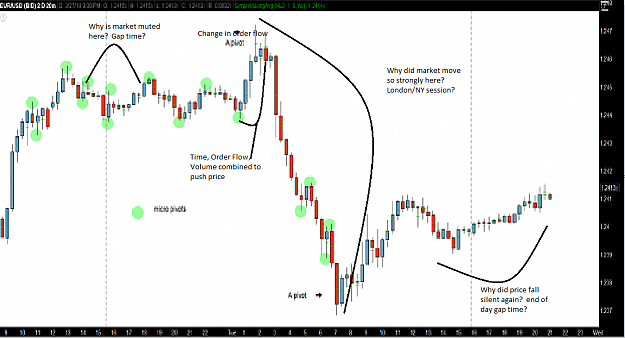
Understood and agreed....however I am trying to dig a bit deeper. Pivots, support, resistance "spent energy"...really boil down to these four market forces CREATING the price movement, not the other way around.

A fresh look at your chart?
Attached Image (click to enlarge)
Click to Enlarge

Name: Screenshot1.png
Size: 176 KB
Do more of that which succeeds and less of that which does not - Dennis Gar
 
 
  • Post #14
  • Quote
  • Mar 27, 2018 10:37pm Mar 27, 2018 10:37pm
  •  DonPato
  • Joined Dec 2015 | Status: Member | 1,509 Posts
Quoting GEfx
Disliked
Do you want to limit discussion to the 4 components you've listed? My view of market structure is quite different from yours.
Ignored
No limit...I truly encourage you to share your point of view...I may or may not agree with it but I will not belittle it or you.
Do more of that which succeeds and less of that which does not - Dennis Gar
 
 
  • Post #15
  • Quote
  • Mar 27, 2018 11:01pm Mar 27, 2018 11:01pm
  •  DonPato
  • Joined Dec 2015 | Status: Member | 1,509 Posts
Great conversation friends...lets keep it going!!

So, now lets mix in Order Flow...as we all know this is literally the flow of orders coming into the market. And as we all know that each order big or small must have a counter party. A buy and a sell matched together. No one...NO ONE...can participate in the market if there isn't at least one counter party to take the other side of your order. Without two sides no "market" exists. I have heard orders described as "aggressive" or "passive". While I try not to use adjectives to describe the structure of the market this analogy can be useful to visualize the TIME element in the market.

Basically there are two types of orders...market and pending. Market orders are those orders that are entered immediately when you hit the "BUY NOW" button. They are transacted on the last quote of your feed (assuming your feed is really fast). However, due to TIME issues your order may slip because your order didn't make it to the computer fast enough...but I digress

The other type of order is a pending order which you place to be filled when the price reaches a certain point. Thus pending orders are considered less aggressive (or passive) while market orders are considered aggressive. Bottom line...

All orders both buy and sell must be matched with a counter party. Assuming that those orders are satisfied any remaining unmatched orders will determine whether the next tick is up or down...the market will tick higher to fill unsatisfied buy orders, and conversely it will tick lower to fill unsatisfied sell orders. It really depends on where the surplus of orders is at any given moment (yet another element of time).

This also leads us squarely to VOLUME. The size of each order also has a direct effect on price movement. If you or I want to transact our puny mini-lot we can get filled immediately...and in fact the order is probably absorbed by your broker. (who becomes the counter party to your trade). However, if you are SaxoBank and you want to move 1,000 standard lots, you need a whole lot of single or double lot traders to complete or satisfy your order. Thus this surplus of unfilled volume literally creates order flow in the market causing price to move...

AT this point I would call it a toss up...like the chicken and the egg... Does order flow beget volume? Or does Volume beget order flow? Does it matter. If you see price moving...both are at work. Thus even before that "statistical price pattern" has formed, you can recognize that the order flow/volume is creating movement in one direction or another...and conversely, you can see those forces waning...especially if it is right before a major news announcement (at what time?) or the open of the NY session...yet another time.

TIME...ORDER FLOW...VOLUME...then PRICE.
Do more of that which succeeds and less of that which does not - Dennis Gar
 
1
  • Post #16
  • Quote
  • Mar 27, 2018 11:21pm Mar 27, 2018 11:21pm
  •  genghistar
  • Joined Mar 2012 | Status: Servant of wealth | 1,191 Posts
Quoting DonPato
Disliked
Hello all...I've tried several times to stimulate some conversation around this topic. I don't know if it's too boring or if no one is really interested. But I am going to try one last time...HELL OF A WAY TO START A THREAD... I would truly appreciate any and all points of view on the topic of the "structure" of the market...meaning how and why do you think the market actually functions? Further...knowing this, how does this knowledge assist you or facilitate your trading? I ask this because I see many threads out there with many different...
Ignored
I believe you are at a stage where you know what's is needed to know in order to develop a qualitative method to trade the market successfully.
In my humble opinion your first component of time or timing is directly connected to the four one. The other two are inconsequential and unquantifiable.
My edge is best described in four simple steps specifically on your last component of price and it's various dynamic levels to effect pullback/retracement, or reversal in intraday, midterm and long term price actions. Until all these levels are known and understood then it's possible to put them in an trading actions plan on how to trade it efficiently and optimally. Until this is all learn and reached the rests are all guesstimate at best. I have yet to see any trader advocating this method actively in this forum.
This is my personal perceptions and experience on the market structure which I am sharing and while others are welcome to disagree with me but I will not discuss my matrix in greater details and leave it just as that.

Cheers...happy trading and trading happily.

GS
 
1
  • Post #17
  • Quote
  • Mar 28, 2018 12:10am Mar 28, 2018 12:10am
  •  Sossos
  • Joined Apr 2013 | Status: Member | 684 Posts
TIME

As a forex trader I don't have access to volume data. But I can observe what a market does when energy is spent and where price ends up a few bars later. What THEY are doing. I can only participate in what THEY are doing. I really don't care how many orders get moved in a days trading in a market. I'm interested in how they did it and can I find habits that can be used to my advantage. Every trader is his or her's own crazy. I see the market on the time frame that I prefer with my eyes and see things that other don't and vice verse. Nothing wrong with that, that's what makes a market.

It's taken me 11 years to wean myself of indicators. That doesn't mean I don't measure the market. To be honest I still turn on an ATR of 1 now and then to identify bars I find important. A well drawn median line has price going to the median line over 80% of the time, but the key is WELL drawn. So that eliminates the traders that don't want to put in the study to learn how to use that PROJECTING TOOL. Imagine using a tool that is tells you the result 80% of the time. Not many people know that the Kennedy fortune was made by Andrews and Babson back during the depression. Babson made enough money to open a college. Hell he moved Newton's library from England to one of his properties.

Indicators tell you what has happened. Median lines project into the future. It's the only tool I've found that does. But that doesn't mean you can trade because you can put a couple of lines on a chart. If you can't read what the price action is doing it will be a struggle. It doesn't matter why it moves, just that it moves, how fast and far it moves in the time frame that you are measuring from.

One last thing, I'm not here to teach anybody anything. I'm here to open, maybe one person's eyes to the idea that they can take their natural curiosity and answer their own questions about the market. Things like, What happens after a wide range bar and does it matter where it is in the scheme of things? Why did that pullback stop there? Why did that structure work last time and not this time? It doesn't matter what you call something especially if you name it for yourself.

If you ask why and look for the answers for yourself instead of someone else's book or forum you will be better because of your effort. Effort is always rewarded, sometimes not right away, but I believe it's the person who never stops looking, wondering and believing in themselves that will win in the end.

In the trades (carpentry, plumbing etc.) it's called an apprenticeship. Then you advance to journeyman, Then to Master. All of which takes TIME.
 
2
  • Post #18
  • Quote
  • Mar 28, 2018 12:05pm Mar 28, 2018 12:05pm
  •  DonPato
  • Joined Dec 2015 | Status: Member | 1,509 Posts
Quoting Sossos
Disliked
TIME As a forex trader I don't have access to volume data...
Ignored
Ah but you do...all brokers display volume data as tick data...granted it is not the same as "true" data because it is only counting transactions, but you can use tick data in a way that is advantageous and profitable. I would encourage you to read another thread I started on this very subject...https://www.forexfactory.com/showthread.php?t=723604


Quoting Sossos
Disliked
...But I can observe what a market does when energy is spent and where price ends up a few bars later. What THEY are doing. I can only participate in what THEY are doing. I really don't care how many orders get moved in a days trading in a market. I'm interested in how they did it and can I find habits that can be used to my advantage.
Ignored
It sounds like you and I have some very similar views on the market from a practical standpoint. What I would also encourage is that you try and understand your observations from a structural point of view...in this case order flow...even though you don't "see" it as such. Order flow and volume is what is responsible for your observations and when you can "see" it via the response in price you can also "see" when the order flow is waxing and waning...and/or about to reverse. I'm sure I don't need to tell you what an advantage that would be...

Again, I started a thread also on this subject...https://www.forexfactory.com/showthread.php?t=613543

I feel that when we put all these elements together...and learn to see them through the lens of the "structure" of the market we will eventually become the journeyman you speak of.

I had a mentor who was able to pull money out of the market seemingly at will. Every day he would come away with at least some small gain...even if he had losses on that day he would come away with something to at least pay for the day's market costs. This is how he taught me to look at the markets...from a structural point of view...I feel that finally (after more than 14 years doing this) it is sinking in on a practical level. It literally required me to change the way I think.
Do more of that which succeeds and less of that which does not - Dennis Gar
 
 
  • Post #19
  • Quote
  • Mar 28, 2018 12:41pm Mar 28, 2018 12:41pm
  •  DonPato
  • Joined Dec 2015 | Status: Member | 1,509 Posts
Quoting genghistar
Disliked
I believe you are at a stage where you know what's is needed to know in order to develop a qualitative method to trade the market successfully...
Ignored
A very kind compliment sir, thank you. I actually have developed a methodology for trading using these elements and have since rewritten my trading plan to include the "theories" I am speaking of here. I, however, do not view them as theories but as principles of how the market actually functions.

Quoting genghistar
Disliked
...In my humble opinion your first component of time or timing is directly connected to the four one....
Ignored
This is a very common point of view. Most of us from the onset realize there is a time/price relationship in entering and exiting the markets. And if you are anything like me you've spent many years trying to accurately define that point. But this has always left "gaps" in my understanding and questions as to "why" price would always move just a little bit more until it turned...usually this little bit more is what took out my stop...

Those holes were filled when I began an exhaustive study of order flow and volume (when I switched to the futures market). There I realized that it is really the FOUR elements working in concert that creates the patterns and the "right price at the right time" entry or exit.

Quoting genghistar
Disliked
..The other two are inconsequential and unquantifiable...
Ignored
I'm afraid that here we disagree. The other two elements (order flow and volume) are absolutely consequential and only unquantifiable because of the way the FX market works...but trading other markets, futures, commodities, stocks...any market with a central exchange...those elements are given and can be used. I have found a way to quantify these elements in the FX market as well...it is an extrapolation but it works well and can be used in concert with the other two elements to create a good edge.

As a side note, the element of least consequence for me is price...it is almost incidental. If I am going to buy...what matters least is where (what price I buy) as much as do I think price will rise AFTER I've entered. I feel that part of speculation is where order flow and volume play the most important role. Likewise...when I want to exit I want to do so as efficiently as possible, thus it is order flow and volume along with time that convinces me WHEN to exit...Price only determines how much I profited...not how I enter or exit.

One caveat to the above statement. When I am day trading futures, I do exit with price because I have a set goal (in points) I wish to gain on each trade to balance the risk. Thus I feel that once that goal has been reached there is no reason to continue to allow time risk (another concept in trading) to potentially erode profits. I often exit WAY too soon. But as the goal for this type of trading is very different than my FX trading, I am OK with that. My futures trading is income producing while my FX trading is growth oriented....completely different trading concepts and goals.

Quoting genghistar
Disliked
...My edge is best described in four simple steps specifically on your last component of price and it's various dynamic levels to effect pullback/retracement, or reversal in intraday, midterm and long term price actions. Until all these levels are known and understood then it's possible to put them in an trading actions plan on how to trade it efficiently and optimally. Until this is all learn and reached the rests are all guesstimate at best...
Ignored
I attempted this method as well using every technique I could find...supply/demand lines...Fibonacci...Elliot waves...ichimoku...Andrews pitchfork...the list for me is over 100. In each case there are several "legitimate" levels where one can take action based on Price patterns, but often fail. This approach lead me to the inevitable question, "why did price turn on level x and not level y?" The only logical answer is the very basis of structural thinking...Price turned at level x because THAT's where the order flow changed. Thus, while levels are good to track and I track them too...I do NOT take action just because price is at point x or because its at (or near) point x and price pattern abc has occurred. I take action because I see the order flow wane...the volume drop off...then order flow changes and volume picks up. Usually these events correspond with some level somewhere, but more importantly they will correspond with time...like that turning point in the e-mini that occurs usually between 9:45-10:15 (EST)...Or the near "silent" price action that occurs just before NFP.
Do more of that which succeeds and less of that which does not - Dennis Gar
 
 
  • Post #20
  • Quote
  • Mar 28, 2018 2:33pm Mar 28, 2018 2:33pm
  •  Sossos
  • Joined Apr 2013 | Status: Member | 684 Posts
OK, Don I have a question and maybe you answer it after page 5 of your other thread, but here goes anyway.

I trade intra-day forex. If I take your concept to the intra-day side of things could I run an ATR of say 36 on a 15 or 20 minute chart and come up with an average range of the timed bar. Then set up a tick chart with an ATR of 36 that puts me close in size to my time chart. That tick chart would put me about as close as I could get to correlating the sizes. Does that seem reasonable? Have you thought of that or tried it?
 
 
  • Trading Discussion
  • /
  • "Structure" of the market
  • Reply to Thread
    • Page 1 234 5
    • Page 1 234 5
0 traders viewing now
  • More
Top of Page
  • Facebook
  • Twitter
About MM
  • Mission
  • Products
  • User Guide
  • Blog
  • Contact
MM Products
  • Forums
  • Calendar
  • News
  • Market
MM Website
  • Homepage
  • Search
  • Members
  • Report a Bug
Follow MM
  • Facebook
  • Twitter

MM Sister Sites:

  • Energy EXCH
  • Crypto Craft
  • Forex Factory

Metals Mine™ is a brand of Fair Economy, Inc.

Terms of Service / ©2023