TP & SL Tool: Risk Reward Ratio Calculator RRR MT5 | Prop Firm Protector: Trade Assist Prop Firm Plus TF Expert MT5 | Money Management + DrawDown Protector: Trade Panel Prop Firm Drawdawn Limiter Pro MT5 |Get a free Expert Advisor license via Telegram and WhatsApp
The Role of the Fibonacci Tool in ICT Trading
In ICT trading, Fibonacci tools are essential for pinpointing price targets, retracement areas, reversals, and convergence points with other technical indicators. Traders utilize Fibonacci projections in combination with Standard Deviation levels to better identify probable zones of trend reversal or continuation.
Fibonacci Settings for the Standard Deviation Tool
The Standard Deviation tool incorporates specific Fibonacci levels tailored for ICT analysis. The key Fibonacci ratios used are:
- 1
- 0
- -1
- -2
- -2.5
- -4
These levels represent various retracement and extension zones, enabling traders to determine strategic entry and exit points.
Applying the Fibonacci Tool to Forecast Price Movements
To effectively use the Fibonacci tool in ICT-style market analysis, the following steps are crucial:
1. Identifying the Smart Money Reversal Point
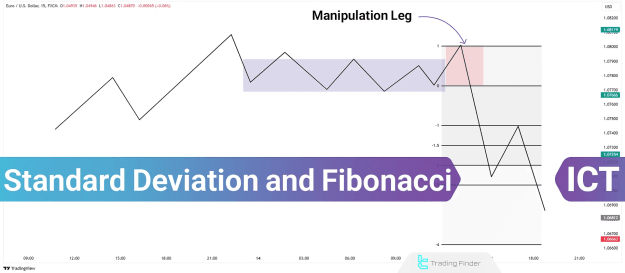
- Recognize the initial leg of price manipulation, often observed after a strong trend followed by a corrective move.
- This leg serves as the anchor for plotting Fibonacci levels.
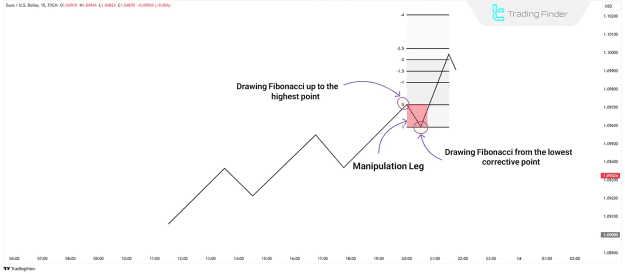
2. Predicting Targets and Key Zones
- Draw Fibonacci retracement levels from the low to high (or vice versa) of the manipulation leg.
- Pay attention to Standard Deviation zones, particularly the -2, -2.5, and -4 levels, which are critical price targets.
How the Standard Deviation Tool Enhances Market Analysis
- Identifies significant retracement and reversal zones.
- Signals potential trend reversals when price reaches between the -2 and -2.5 levels.
- Suggests continued trend expansion if price breaks beyond the -2.5 zone, targeting the -4 level for maximum extension.
Integration with Other Technical Tools
A major advantage of using Standard Deviation in the ICT trading framework is its synergy with other tools such as:
- PD Arrays: These highlight critical price levels like Fair Value Gaps (FVG) and confluence points, which often align with Standard Deviation zones.
- Confluence Levels: When Standard Deviation projections coincide with other key technical levels, prediction accuracy improves significantly.
Combining Fibonacci and Standard Deviation Tools in ICT Style
In the ICT methodology, Fibonacci and Standard Deviation tools are combined for a comprehensive analysis of market structure. Drawing the Fibonacci tool automatically reveals Standard Deviation levels, simplifying the identification of key price zones.
Practical Examples
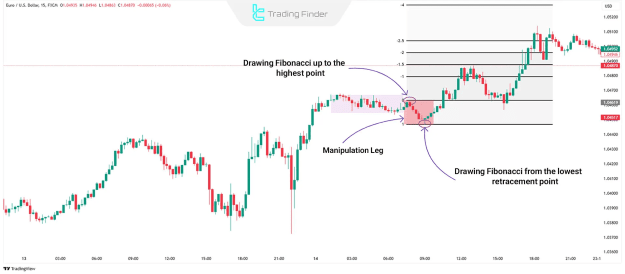
Bullish Scenario
- On the EUR/USD 15-minute chart, the Fibonacci tool is drawn over a bullish manipulation leg.
- After a consolidation phase, smart money triggers a strong upward move.
- Specialized Fibonacci settings highlight expansion levels for anticipated upward price targets.
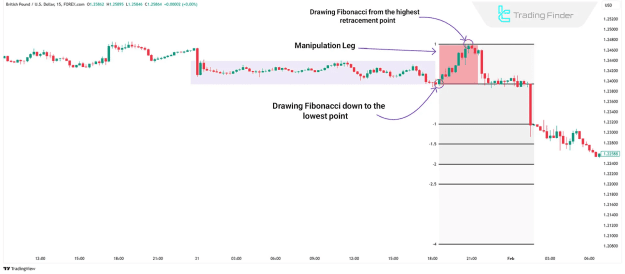
Bearish Scenario
- On the GBP/USD 15-minute chart, the Fibonacci tool is applied to a bearish manipulation leg.
- Following a range, price initially moves higher before smart money intervention causes a reversal downward.
- Fibonacci levels reveal critical expansion zones for the downward move.
Conclusion
The combination of Standard Deviation and Fibonacci tools in ICT trading provides a robust framework for anticipating price retracements, reversals, and expansions. This integration enhances traders’ ability to identify manipulation legs and key market structures, improving decision-making and trade accuracy.