What is Top-Down Analysis?
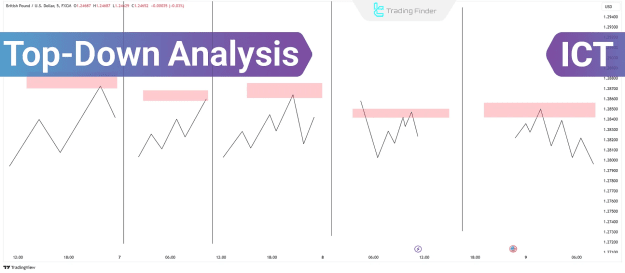
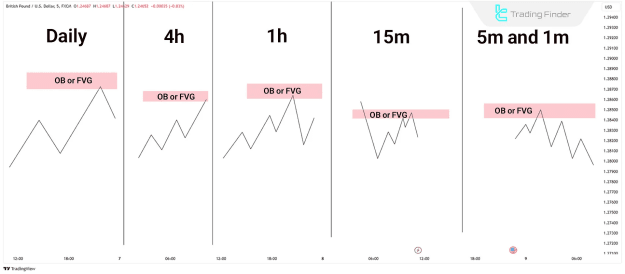
Top-Down Analysis begins by examining higher timeframes to identify macro trends and significant price levels. Subsequently, traders progressively narrow their focus to lower timeframes to achieve precise trade entries. This methodology enhances market understanding, refines decision-making, and minimizes trade risk.
Benefits of Top-Down Analysis
The advantages of employing Top-Down Analysis include:
- Market Structure: Provides a clear and comprehensive view of the market structure and overarching trends.
- High Accuracy: Facilitates the identification of highly precise entry and exit levels for trades.
- Risk Management: By aligning trades with higher timeframe trends, traders can effectively lower their risk exposure.
How to Perform Top-Down Analysis
Traders commence their analysis by scrutinizing higher timeframes to define the market's overall bias, then transition to lower timeframes to refine their trade execution.
#1 Daily Timeframe (D1)
The process for analyzing the daily timeframe involves:
- Identifying key levels such as Order Blocks (OBs), Fair Value Gaps (FVGs), and previous significant highs or lows.
- Highlighting crucial important zones, including areas of support, resistance, and liquidity.
#2 4-Hour Timeframe (H4)
The approach to analyzing the 4-hour timeframe is as follows:
- Confirm the key levels identified on the daily timeframe.
- Concentrate on FVGs or blocks that align with the daily market structure.
- Consider incorporating session-based analysis, such as the New York Kill Zone.
#3 1-Hour Timeframe (H1)
The examination of the 1-hour timeframe is outlined below:
- Validate how higher timeframe zones interact with current price action.
- While the H1 timeframe may not always provide novel insights, it is instrumental in confirming market bias.
#4 15-Minute Timeframe (M15)
The method for analyzing the 15-minute timeframe includes:
- Observing how price reacts to the zones marked from higher timeframes.
- Identifying specific price behaviors such as liquidity grabs, displacement moves, or FVG reactions.
#5 Lower Timeframes (M5 & M1)
The following steps describe the analysis of lower timeframes:
- Searching for precise entry triggers, including FVG rejections and market structure shifts.
- Considering specific setups like Break of Structure (BOS), Change of Character (CHOCH), or Mitigation Blocks.
- Utilizing lower timeframes to minimize risk and optimize trade execution.
Example of Using Top-Down Analysis
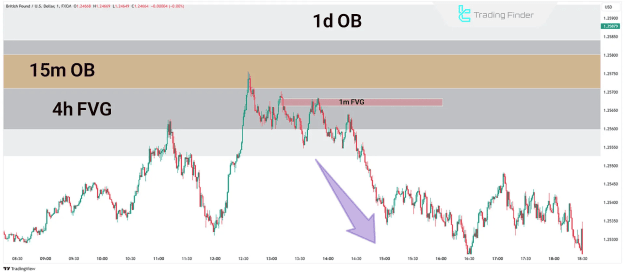
Consider a GBP/USD chart. Initially, the Order Block (OB) and Fair Value Gap (FVG) are identified on higher timeframes. On the lower timeframes (e.g., M1), price confirms a market structure shift. Upon the price reaching the identified OB or FVG, a clear entry opportunity is revealed.
Conclusion
Top-Down Analysis stands as a robust and structured approach for identifying market trends and uncovering high-probability trade setups. By systematically moving from higher timeframes down to lower timeframes, traders can effectively reduce risk, refine their trade execution, and significantly improve their overall accuracy.