STH & ITH & LTH Indicator:
STH & ITH & LTH Indicator MT4
STH & ITH & LTH Indicator MT5
STL & ITL & LTL Indicator:
STL & ITL & LTL Indicator MT4
STL & ITL & LTL Indicator MT5
What is Market Structure?
Market structure refers to the discernible patterns of price movement within a specific timeframe. By analyzing the formation of price highs and lows, traders can gain insights into overarching trends and market dynamics.
Types of Market Structure
- Bullish Market Structure: Characterized by a sustained upward price movement, marked by the consistent formation of long-term higher highs and long-term higher lows on the price chart.
- Bearish Market Structure: Indicates a consistent downward price movement, identified by the continuous formation of long-term lower lows and long-term lower highs.
- Sideways Market Structure: In this scenario, prices oscillate within a defined horizontal range, with highs and lows repeatedly forming at comparable levels.
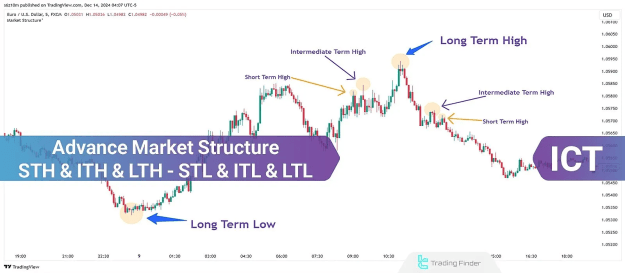
Types of Advanced Market Structure (ICT Style)
The advanced market structure in ICT style categorizes specific highs and lows to provide a more nuanced understanding of price action.
Highs: STH, ITH, LTH
Within the advanced market structure framework, three distinct types of highs are identified:
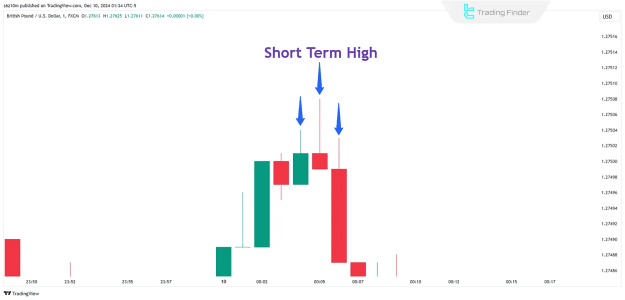
- Short Term High (STH): In ICT analysis, an STH is a three-candle swing high. The middle candle's upper wick is notably higher than the highs of both the preceding (left) and succeeding (right) candles, thus designating the middle candle's high as the Short Term High.
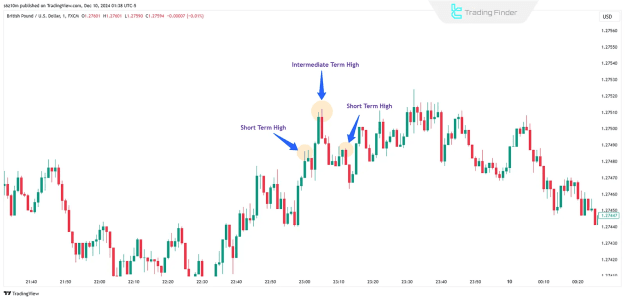
Illustration: A visual representation of a Short Term High (STH) with the middle candle's high exceeding those of its immediate neighbors. - Intermediate Term High (ITH): An ITH is essentially a Short Term High, but it is further characterized by having lower Short Term Highs positioned on both its left and right sides. This signifies that the ITH is the highest STH within its immediate vicinity.
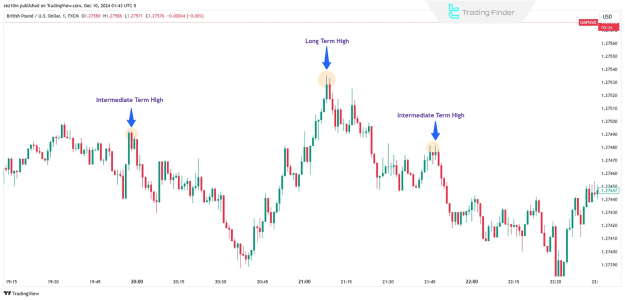
Illustration: An Intermediate Term High (ITH) prominently situated between two lower Short Term Highs (STHs). - Long Term High (LTH): A Long Term High is an Intermediate Term High that typically forms on a higher timeframe, often following a significant price reaction within a Premium/Discount (PD) array. An LTH is recognized as an Intermediate Term High that is positioned in the center of two other Intermediate Term Highs, representing the highest ITH with lower ITHs on either side.
Illustration: A Long Term High (LTH) centrally located between two lower Intermediate Term Highs (ITHs).
Lows: STL, ITL, LTL
Analogous to highs, three types of lows are categorized within this advanced market structure:
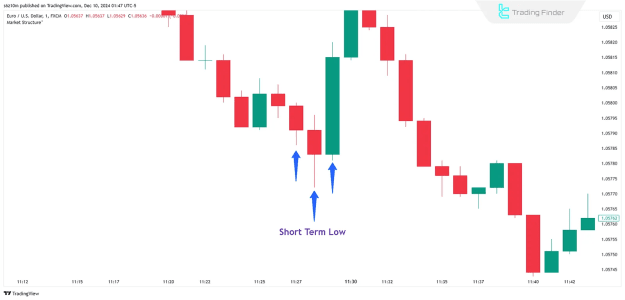
- Short Term Low (STL): In ICT analysis, an STL is a three-candle swing low. The middle candle's lower wick extends below the lows of both the preceding (left) and succeeding (right) candles, thereby identifying the middle candle's low as the Short Term Low.
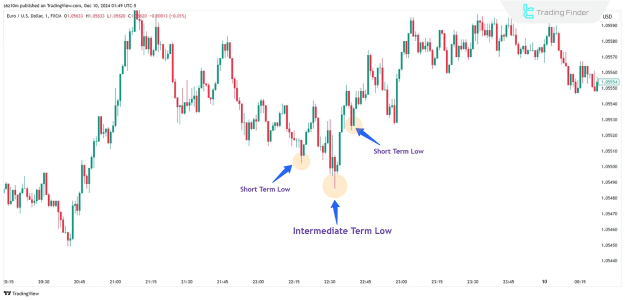
Illustration: A visual representation of a Short Term Low (STL) with the middle candle's low falling below those of its immediate neighbors. - Intermediate Term Low (ITL): An ITL is fundamentally a Short Term Low, but it is distinguished by having higher Short Term Lows situated on both its left and right sides. This indicates that the ITL is the lowest STL within its localized range.
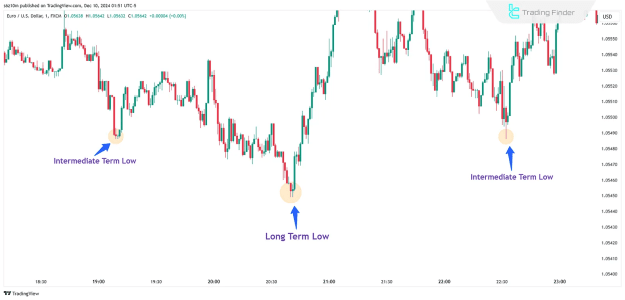
Illustration: An Intermediate Term Low (ITL) clearly positioned between two higher Short Term Lows (STLs). - Long Term Low (LTL): A Long Term Low is an Intermediate Term Low that typically emerges on a higher timeframe, often subsequent to a price reaction within a Premium/Discount (PD) array. An LTL is defined as an Intermediate Term Low that is positioned in the center of two other Intermediate Term Lows, representing the lowest ITH with higher ITHs on either side.
Illustration: A Long Term Low (LTL) centrally located between two higher Intermediate Term Lows (ITLs).
Conclusion
In a bullish advanced market structure, prices consistently establish higher highs and higher lows through continued Break of Structure (BOS) over the long term. The bullish trend remains intact until the most recent higher low is decisively breached, signaling a potential reversal, often referred to as a Change of Character (CHoCH) or Market Structure Shift (MSS). Conversely, in a bearish advanced market structure, prices consistently form lower lows and lower highs over the long term. The bearish trend persists unless the most recent lower high is broken, which would also indicate a potential shift in market bias.