In this guide, I'll show the Support & Resistance indicator that will help you identify these levels.
Features of Support & resistance Indicator
The Support & Resistance indicator helps you in your daily trading. The indicator automatically identifies levels with which the price has previously interacted and displays them as rectangular regions on the MT4 chart.
You can determine the price range (height) of support or resistance regions by the gap between the level's highs and lows. Support levels are marked in blue, while resistance levels are illustrated in orange.
The good thing about the Support & Resistance indicator is you don't have to apply it on the chart every time. On the flip side, the emergence of new highs/lows within the range of a certain support/resistance can increase that support/resistance height.
Although you can apply the indicator on every timeframe, it works best on the 15-minute and 1-h charts.
How does the Support & Resistance indicator draw levels?
You can draw support and resistance levels in various ways. The Pivot Points indicator, for example, does this by using data from prior candlesticks. The S&R indicator, in turn, determines the levels with the most price hits.
Because everyone interprets price action differently, it is subjective knowledge. As a result, we employed an easily accessible Fractal indicator to spot price action, which is also price extremes.
Because the Fractal indicator's algorithm is independent of time, you can use the Support and Resistance indicator on any timeframe.
Although the indicator works well with all timeframe, it’s best to apply it on lower timeframes, so it can draw levels and give you an idea of price touches accordingly.
The indicator algorithm will find the levels with the most price interactions and display them on the chart after recognizing and noting the price course.
Click the weight number on the left side of the rectangle to observe the price interactions with a certain level.
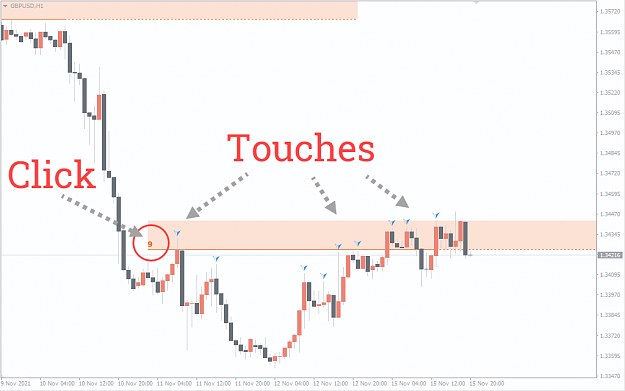
Some of the contacts are outside of the full area, as you can see; however, this is not due to the indicator's inaccuracy. Instead, these touches are used to distinguish levels more accurately.
The algorithm's support and resistance levels take up a little under half of the total area evaluated.
How does the indicator work?
Support and resistance are significant price levels that you can use for forex trading. As a result, the S&R indicator works well with other technical indicators and trading systems.
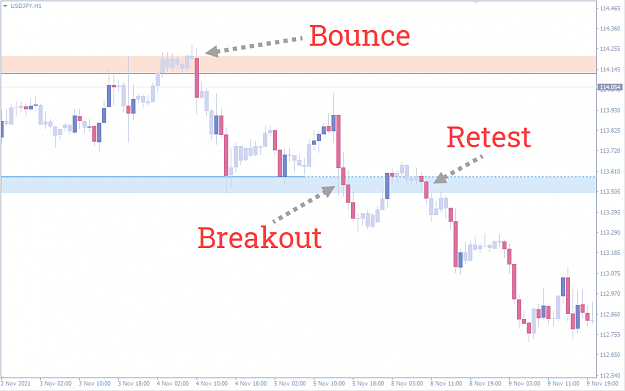
There are three major practices you can apply strong support and resistance levels:
Their advantage is that they are simple enough that even a beginner trader can apply them.
- Rebound (Bounce) from a level,
- Level breakout,
- A retest of the broken level.
You can also take an interest in the AutoTrendLines indicator. It makes one of the most difficult tasks for a trader, identifying the primary trend, much easier. The indicator detects precise trend lines and draws them on the chart automatically.
Settings
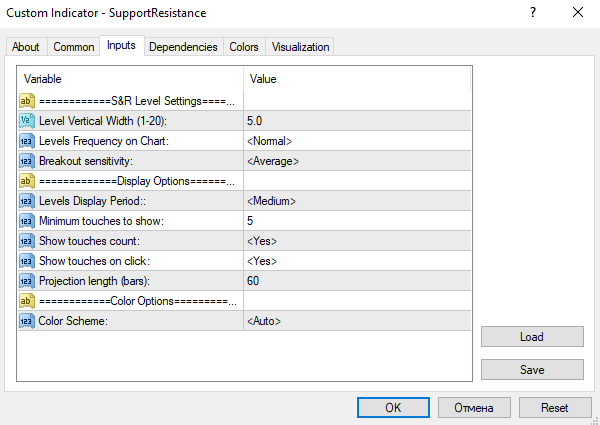
There are many tabs in the indicator's settings panel. You should have no problems with them in general. As a result, we'll simply look at the options on the "Inputs" tab.
"Level Settings" Block
- Level Vertical Width: It determines the maximum height of support and resistance zones. This option is set to 5.0 by default. Thus, the wider the price range covered by the depicted support and resistance levels, the better the value.
- Levels Frequency on chart: It defines the frequency of levels displayed on the MT4 graph on the chart. The parameter's default value is "Normal."
If required, you might replace it with "More." The indicator will display additional levels within a comparable price range in this situation. You may also choose "Less" as an option. Only the most significant support and resistance areas will be shown on the chart in this situation.
- Breakout Sensitivity: The indicator's sensitivity to level breakout is known as breakout sensitivity. This level is disrupted when the price generates a specified number of fractals outside of the broken level.
Levels are interrupted more frequently if the sensitivity is high; they are interrupted less frequently if low. The "Breakout sensitivity" is set to "Average" by default.
"Display Options" Block
- Levels Display Period: The depth of the history applied to draw support and resistance levels is determined by the Levels Display Period.
"Medium" is the default value. In this situation, the levels are drawn inside the period, which is no more than 600 candlesticks in the present timeframe. To draw levels, you may choose between 300 bars (Levels Display Period= "Short") and 1200 bars (Levels Display Period= "Long").
- Minimum Touches to Show: Its value is set to 5 by default. It implies the indicator will only draw support and resistance levels with which the price has interacted at least five times.
- Sow Touches Count: Touches are important. There are just two possible values for this parameter: "Yes" and "No." If "Yes" is selected, the number of price interactions with the level (the level's weight) is shown next to it. This information is not displayed if "No" is selected.
- Show Touches on Click: When you click the number, show touches on click displays the price interactions with the level. You may use this option to see where and when the price hit a support or resistance level. The option can be deactivated if required. Set "Show touches on click" to "No" to do this.
- Projection Length: It determines the length of the dashed line (projection) in bars.
"Color Options" Block
Color Scheme: The indicator recognizes the color scheme automatically based on the chart background by default. If required, choose a color scheme from the drop-down menu.
At the time, there were no alerts available for this indicator.
Indicator Installation
Download Link
- Download and unzip the archive to the MQL4 folder of the terminal;
- Restart the terminal and run the indicator;
- Allow import of DLLs.