Here's an article that explains the recent and nearly unprecedented deviation between spot and COMEX gold prices.
https://maalamalama.com/wordpress/co...kwealthacademy
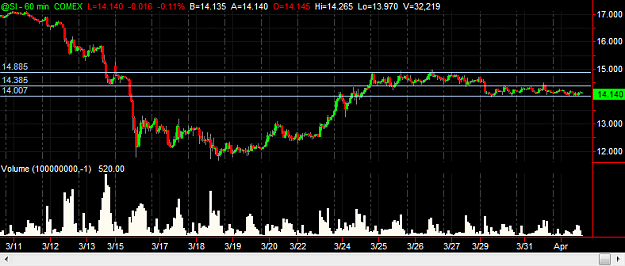
The short version is paper gold (futures) issuers were forced to pay a premium to get those wanting physical gold delivery to instead accept paper gold (ETFs) when the CME 86% margin increase for COMEX gold (and 73% margin increase for silver) compounded with a global reduction of leverage failed to force enough buyers out of the market. They claim this is due to COVID-19 making physical deliveries impossible but I believe the general consensus, that they simply don't actually have the amount of physical gold they claim, is the more likely reason.
...
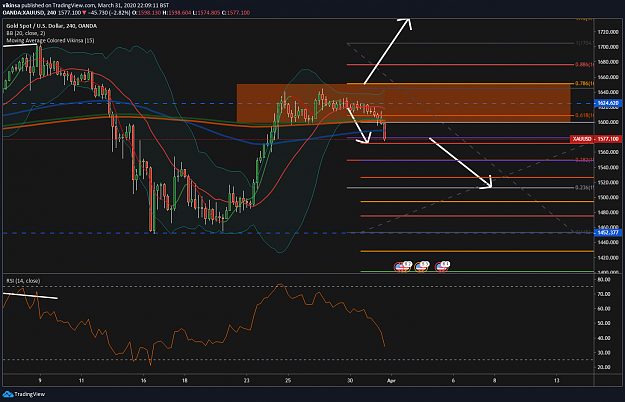
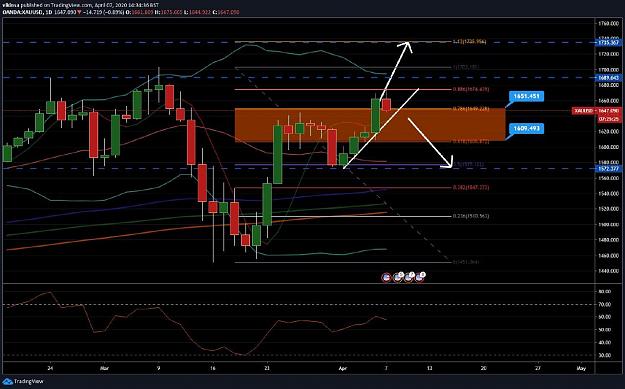
Given the massive devaluation of the U.S. dollar due to some 20 trillions or so of USD being printed, I don't expect the desire for physical gold and silver (and we may have to include palladium now too given the recent price surge contrary to manufacturing demand) will be any less when the next COMEX futures strike date nears so this price divergence may be something we have to learn to live with unless they figure some way out of their current physical shortage predicament. This will certainly make short-term charting for those who rely more on price data than momentum as their buy/sell indicators challenging.
Anyone who's still following this thread since we old regulars disappeared years ago may remember I prefer RSI min/max, RSI trend lines, and RSI divergences as triggers/confirmations with converged price action Fibonacci and trend lines indicating "natural" (unmanipulated) market target levels. I've recently adopted the use of price volume histograms for trading on shorter time frames during periods of low volatility to highlight initial key price pivots for $2 to $3 price vacillation trades. This is by no means my preferred trading method but it has proven to be a reliable way to make extra money while waiting for markets to open and/or larger moves to set up/play out. The alignment of candle tops and bottoms make these levels increasingly obvious over time and act as confirmation, being aware that the longer they continue the greater the likelihood of either a breakout or fakeout occurring. Monitoring RSI on a longer time frame will help indicate when time is running out for any particular price range. It's better to get out early with profit after small series of successful trades than roll the dice one more time and end up eating a loss. On a related note, don't abandon your 4:1 or greater profit-to-loss ratio for setting your target limits and stops even though you're trading tiny amounts rather than big moves.
https://maalamalama.com/wordpress/co...kwealthacademy
The short version is paper gold (futures) issuers were forced to pay a premium to get those wanting physical gold delivery to instead accept paper gold (ETFs) when the CME 86% margin increase for COMEX gold (and 73% margin increase for silver) compounded with a global reduction of leverage failed to force enough buyers out of the market. They claim this is due to COVID-19 making physical deliveries impossible but I believe the general consensus, that they simply don't actually have the amount of physical gold they claim, is the more likely reason.
...
Given the massive devaluation of the U.S. dollar due to some 20 trillions or so of USD being printed, I don't expect the desire for physical gold and silver (and we may have to include palladium now too given the recent price surge contrary to manufacturing demand) will be any less when the next COMEX futures strike date nears so this price divergence may be something we have to learn to live with unless they figure some way out of their current physical shortage predicament. This will certainly make short-term charting for those who rely more on price data than momentum as their buy/sell indicators challenging.
Anyone who's still following this thread since we old regulars disappeared years ago may remember I prefer RSI min/max, RSI trend lines, and RSI divergences as triggers/confirmations with converged price action Fibonacci and trend lines indicating "natural" (unmanipulated) market target levels. I've recently adopted the use of price volume histograms for trading on shorter time frames during periods of low volatility to highlight initial key price pivots for $2 to $3 price vacillation trades. This is by no means my preferred trading method but it has proven to be a reliable way to make extra money while waiting for markets to open and/or larger moves to set up/play out. The alignment of candle tops and bottoms make these levels increasingly obvious over time and act as confirmation, being aware that the longer they continue the greater the likelihood of either a breakout or fakeout occurring. Monitoring RSI on a longer time frame will help indicate when time is running out for any particular price range. It's better to get out early with profit after small series of successful trades than roll the dice one more time and end up eating a loss. On a related note, don't abandon your 4:1 or greater profit-to-loss ratio for setting your target limits and stops even though you're trading tiny amounts rather than big moves.
You can always make money tomorrow provided you don't lose it today.
1