Gold is trading in the zone of balance. Buyers perfectly meet sellers, bids have the same weight as asks. Take a look at the chart to see the situation more clearly.
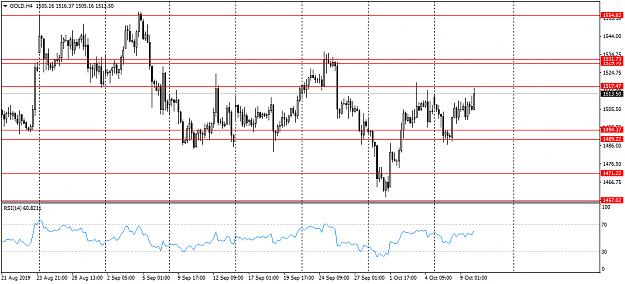
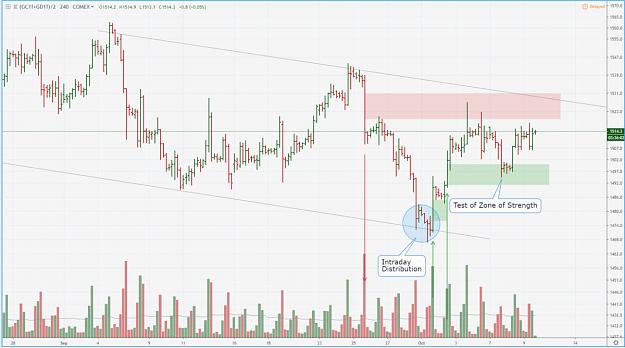
I use Bar chart 4h, futures market on the COMEX Exchange. Red Zone represents the zone of Weakness. It appears from massive #SB (Supply Bar) on 25/Sep.
Since that time, we got advancing Zones of Strength (green squares). As you see, after minor Distribution around Support Zone, Price bounced up on #DB – Demand bar from 01/Oct. Note, how price did settle around the highs of that DB – this is a kind of Strength.
Lately, on 02/Oct we got another #DB. Plot Zone of Strength there. Price tested this Zone on 7/Oct.
So, the outlook is neutral. I can’t see any trustful clues for anticipations. Let’s wait for breakout – fake or real. Gold market is vulnerable to some sort of manipulation, IMO.
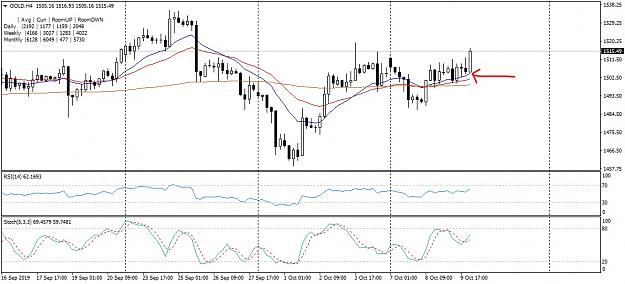
Attached Image (click to enlarge)
Oleg Alexandrov, market analyst. Find me in Google
1