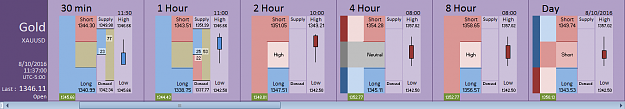
In the previous chart, the FIA indicates we have a High on the 4 Hour and indicates the key market levels from which we expect the Short market to begin.
Note how the candlestick High on the 4 Hour is LOWER than the candlestick High on both the 8 Hour and Day timeframes. The application clearly indicates the market is making a series of Lower Highs. Once again, this constitutes a classic textbook definition of a Short market.
Therefore, we are looking for opportunities to enter the market Short below the key market levels indicated on the 4 Hour timeframe (see chart in previous post above http://www.forexfactory.com/showthre...38#post9069438).
Using the 4 Hour chart, we read "the market remains Short while below 1364.07" (i.e. the Short level).
Finally, the 4 Hour timeframe suggests we have a Short entry @1363.83 or slightly below with a Stop Loss @1364.07 or slightly above.
Using the FIA, traders need only "Sell the Highs" & "Buy the Lows".