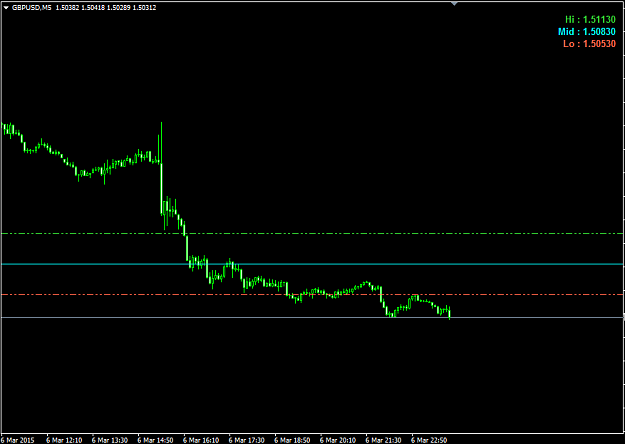
If somebody could obliged me this, I will be most grateful (don't get much luck these days with requests). Just need a simple script to do the following. Draw a horizontal line on a chart. When I drag the line to any point on the chart, it displays the price a number of pips (specified by user) above the line, and the price a number of pips (specified by the user) below the line. So as an example, I specify 300 pips above line, and 250 pips below line. I drag line to say price 1.50000, on chart it will display price above as 1.50250, and price below as 1.49750. As I move the line, the figures change to reflect. Should be able to (1) work correctly (calculate correctly) on both either 4 and 5-digit brokers, (2) able to dictate position to display figures on chart (top left, top right, bottom left or bottom right) so as not obscure other displays on the chart, and (3), as already mentioned, able to specify numbers of pips above and below. Lastly, being able to define line properties (like colour, thickness or style) will be desireable. Many thanks
 I will code your EAs and Indicators for no charge
- #7,363
- Mar 5, 2015 11:14pm Mar 5, 2015 11:14pm
- Joined Feb 2007 | Status: Trader | 2,147 Posts
Trade what you see not what you hope
- #7,367
- Mar 6, 2015 5:58am Mar 6, 2015 5:58am
- Joined Oct 2012 | Status: Trader | 1,959 Posts
Please Do Not PM Me With Coding Enquiries
- #7,377
- Mar 7, 2015 4:39pm Mar 7, 2015 4:39pm
- Joined Oct 2012 | Status: Trader | 1,959 Posts
Please Do Not PM Me With Coding Enquiries
- #7,379
- Edited 11:54pm Mar 7, 2015 9:19pm | Edited 11:54pm
- Joined Feb 2007 | Status: Trader | 2,147 Posts
Trade what you see not what you hope
- #7,380
- Mar 7, 2015 10:45pm Mar 7, 2015 10:45pm
- Joined Oct 2012 | Status: Trader | 1,959 Posts
Please Do Not PM Me With Coding Enquiries