Thanks PW n Hello to all Spend some time to modify an indicator to reflect your strategy, the code is not mine, the update to make like DSP is test it modify to suit, my programming skill are not that great it show the most recent DSP from 96 or whatever number of Bars you like to look back. After loading the indicator Press F8 and from Common Tab, Check Show Object Description, so it can show comment on line as well. {file} {file}
Ignored
Good indicator. You should delete old invalid lines.
Please excuse the bad English via Google Translate.
so sick until now i cant figured out how the strategy / graph works.. can you pls insert another graph with notes how/when the trades take place
Ignored
Where exactly does your understanding stop? This information would help to help . Read 1st Post and then explain your problems in detail. This strategy here is one of the simplest I've ever seen. Thx Password .
All the rules are in the first post, my EA in signal mode aside from drawing lines and boxes out puts valid signals to the experts tab.
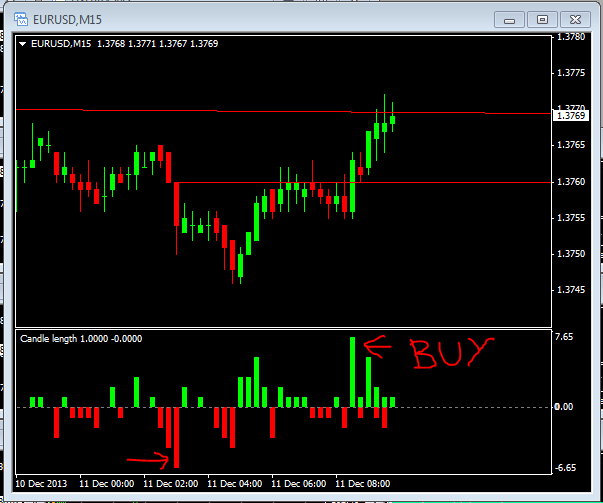
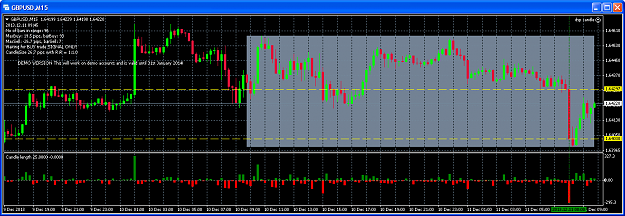
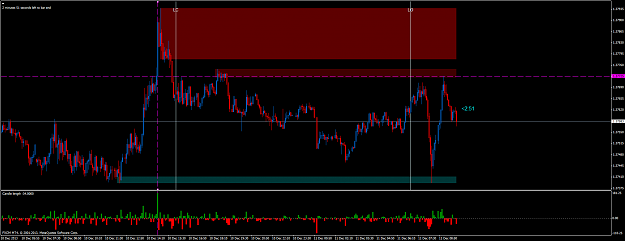
The screenshot below is the current GU M15 and we have a long bearish red candle, see vertical green line, and so we are waiting for price to cross the upper yellow line for a BUY/Long trade. This si based on the rules in post #1.
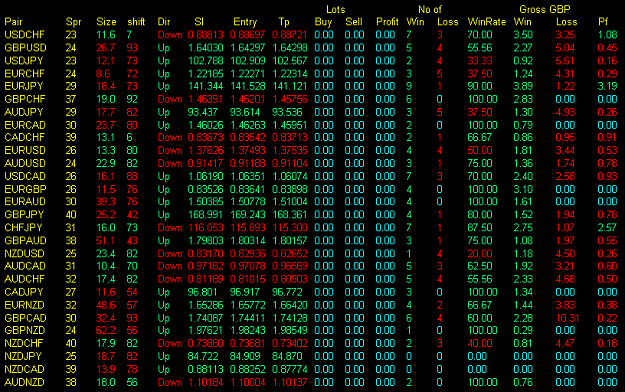
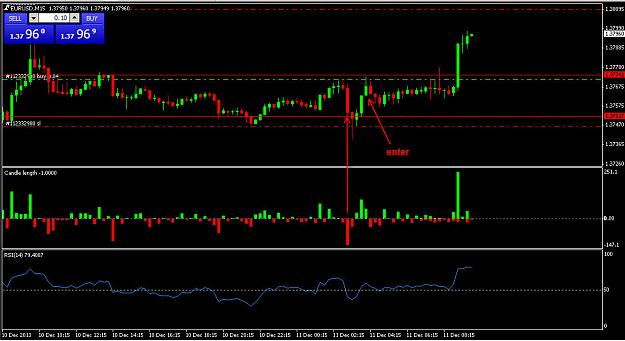
The second screenshot are my results using the rules in post #1 and no TS and a fixed Tp of 10pips.
{quote} Where exactly does your understanding stop? This information would help to help . Read 1st Post and then explain your problems in detail. This strategy here is one of the simplest I've ever seen. Thx Password .
Ignored
ok.. i do understand.
BUY if closed above DSP
SELL if closed below DSP
I dont understand the candle length indicator.
buy X-axis is greater than Y-AXIS
sell if Y-axis is greater than X-axis
should the candle length indicator, tell whether to buy or sell?
{quote} ok.. i do understand. BUY if closed above DSP SELL if closed below DSP I dont understand the candle length indicator. buy X-axis is greater than Y-AXIS sell if Y-axis is greater than X-axis should the candle length indicator, tell whether to buy or sell?
Ignored
Not quite.
BUY if closed above DSP (only if DSP is a bear) SELL if closed below DSP (only if DSP is a bull)
I dont understand the candle length indicator. (Find the 1 largest bar of the last 24 hours, that's your DSP. Don't worry about the axis. This indy is just a tool.)
{quote} ok.. i do understand. BUY if closed above DSP SELL if closed below DSP I dont understand the candle length indicator. buy X-axis is greater than Y-AXIS sell if Y-axis is greater than X-axis should the candle length indicator, tell whether to buy or sell?
Ignored
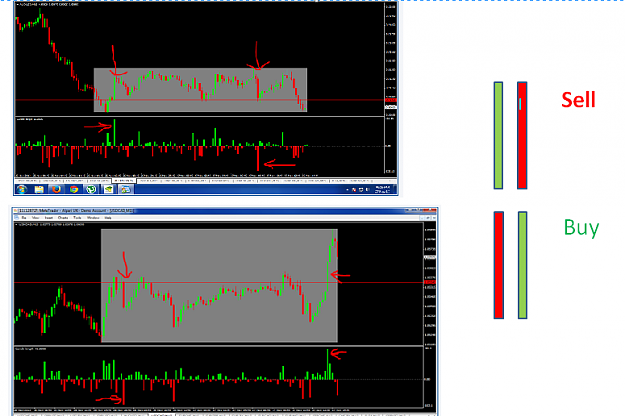
Look at the candle length indicator, see the two numbers on the far right hand side? Positive number above the zero line and Negative number below the zero line.... which number is furthest from the zero line, negative or positive.. if its positive find the biggest buy candle on the indicator, if its negative find the biggest sell candle on the indicator. So if the indicator shows +120 and -170 then we look at the -170 as its furthest from the zero line..you then look for the biggest sell candle. The candle that you identify is now called the Dsp candle.
If the DSP candle that you have identified is a Buy (usually green in most pics) then once price closes below the open of this candle, place a sell trade.
Opposite for a Sell candle.
|
Joined Nov 2012
|
Status: No Impact Member (bottom 1%)
|741 Posts
Maybe this indy will make it easier. Just set 'AboveBelowAxis' to 'false'. Now you will see all bars side by side without the useless axis.
Now find the largest bar on the indy on the last 24hours (96bars if you're on a 15m).
Found it? Is the corresponding bar on the chart a bull? Sell when a bar closes below the open of the DSP.
Is the corresponding bar on the chart a bear? Buy when a bar closes above the open of the DSP.
. This si based on the rules in post #1. The second screenshot are my results using the rules in post #1 and no TS and a fixed Tp of 10pips. Hope this helps Mike {image} {image}
Ignored
Well done for such commitment to create the ea to test the system, but can u kindly interpret the results you got from the test!!
All the rules are in the first post, my EA in signal mode aside from drawing lines and boxes out puts valid signals to the experts tab. The screenshot below is the current GU M15 and we have a long bearish red candle, see vertical green line, and so we are waiting for price to cross the upper yellow line for a BUY/Long trade. This si based on the rules in post #1. The second screenshot are my results using the rules in post #1 and no TS and a fixed Tp of 10pips. Hope this helps Mike {image} {image}
Ignored
Shame to waste time with EA on demo only and expire.
Please excuse the bad English via Google Translate.
Hi All Looks like an interesting thread, just a question about the Candle Length Identifier. Do you leave the 'Candle Body Only' option at true, or change it to false, which must use the wicks as well, both settings give different results. thanks Martin