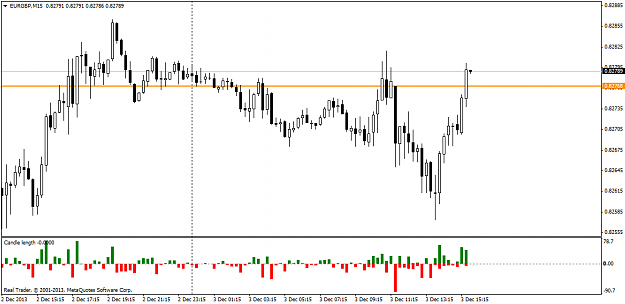
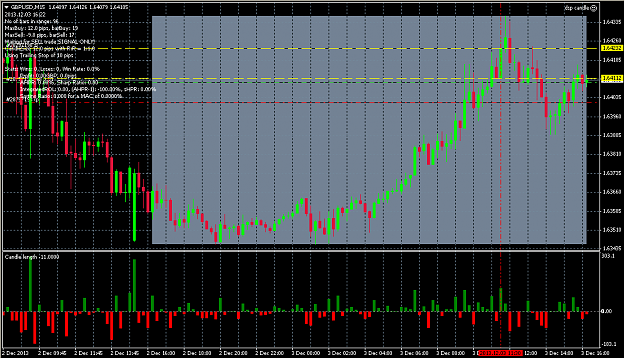
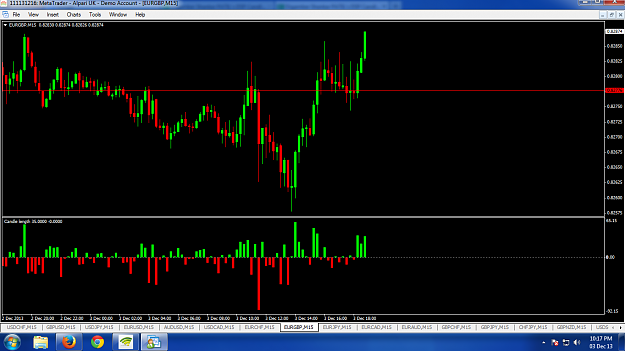
Password kudos for posting this thread. Anyone else seen this strange broker data where the dsp candle doesn't look correct? First one is EU M15 and the second is GU M15. I'm testing on FXCM Spreadbetting account. Regards Mike {image} {image}
Ignored
I use FXCM as well and that is an error in their MT4 feed. At the time news had just been released and the feed went down and didn't come back until 15-20 mins later. However, it doesn't make much difference to the method.
Digamber,
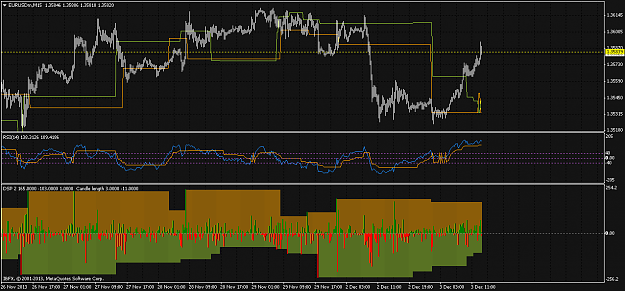
I used your Candle indicator to determine the max and the min of the past 96 bars as shown by the indicator in the subwindow.
The main window has two lines , Orange and Green and are based on your concept that the Open of the Max Candle is a sell (Orange)and the open of the min candle is a buy(green). Drawing these two lines, as they become effective yields a very interesting trading concept. Buy above the two lines, Sell below the two lines and if the pa crosses any line , use as a stop loss or take profit.
Problem is that your indicator is a cpu hog and causes issues.
Problem is that your indicator is a cpu hog and causes issues.
Ignored
Have you checked the source code if it calculates on every tick? It does't have to. It also needs to calculate on every new bar and then only for the last bar. All others can be written into a buffer when initiating. Normally it shouldn't need much cpu power then.
I am just writing on my own indicator to do this. Actually it draws the lines for the current bar and not for the past ones. This has to be implemented in future steps.
Digamber, I used your Candle indicator to determine the max and the min of the past 96 bars as shown by the indicator in the subwindow. The main window has two lines , Orange and Green and are based on your concept that the Open of the Max Candle is a sell (Orange)and the open of the min candle is a buy(green). Drawing these two lines, as they become effective yields a very interesting trading concept. Buy above the two lines, Sell below the two lines and if the pa crosses any line , use as a stop loss or take profit. Problem is that your indicator...
Ignored
Pat
Why do you need to use the other indicator? Why not just scan the last 96bars for candle body size and look for the largest buy and sell candles and use them to draw the lines. I've already written an EA for the system but it is not profitable so i'm still tinkering with ideas, currently testing in Zorro for multiple pairs.
I do like your concept for a trading strategy though.
{quote} Pat Why do you need to use the other indicator? Why not just scan the last 96bars for candle body size and look for the largest buy and sell candles and use them to draw the lines. I've already written an EA for the system but it is not profitable so i'm still tinkering with ideas, currently testing in Zorro for multiple pairs. I do like your concept for a trading strategy though. Regards Mike
Ignored
The other indicator ( Candle Length indicator) helps to find on what side we have to look for the BIG DSP candle: Bullish side or bearish side.
{quote} The other indicator ( Candle Length indicator) helps to find on what side we have to look for the BIG DSP candle: Bullish side or bearish side.
Ignored
So does what i said, all you ahve to do is just check which candle size is bigger out of the max buy candle and max sell candle in the 96 bar range.
That indicator is a visual representation but Pat1 is looking at using the idea to help make a successful trading strategy.
My EA finds the DSP candle and draws lines for me so i can see the dsp candle, it also states the trade direction as well and enters when price crosses as stated in Post #1.
I dont use the candle length indicator for any of this, that was the point i was making to reduce cpu overheads.
This system seems to work well so lets see how it pans out, only forward testing will tell.
Digamber, I used your Candle indicator to determine the max and the min of the past 96 bars as shown by the indicator in the subwindow. The main window has two lines , Orange and Green and are based on your concept that the Open of the Max Candle is a sell (Orange)and the open of the min candle is a buy(green). Drawing these two lines, as they become effective yields a very interesting trading concept. Buy above the two lines, Sell below the two lines and if the pa crosses any line , use as a stop loss or take profit. Problem is that your indicator...
Ignored
Dear Pat..
I would like to request you (and everyone) to follow trading rules mentioned in the first post of this thread. I am following those rules only and can comment on those only. Apart from that I have no experience with other indicators u are trading with. As far as candle length indicator is concern I haven't found any issue with it.
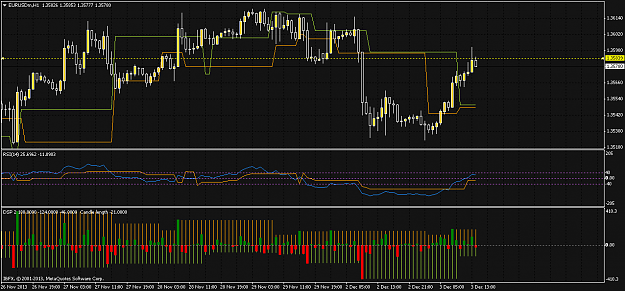
{quote} Thanks for observations... Lots of questions. Try to find answers to all your questions frm following chart.. it made $100+ on demo account. {image} All in all it worked for me.. and may work with others. What i did is just followed what mentioned in first post of this thread. Frankly.. I don't have answers to your smart questions. Excuse me.
Ignored
hi password..
i don't really understand how your trade setup.. i find it interesting but dunno how to choose the bear/bull candle base on DSP.. could you tell us show us why and what are the reason you choose the bull or bear candle???
{quote} Have you checked the source code if it calculates on every tick? It does't have to. It also needs to calculate on every new bar and then only for the last bar. All others can be written into a buffer when initiating. Normally it shouldn't need much cpu power then. I am just writing on my own indicator to do this. Actually it draws the lines for the current bar and not for the past ones. This has to be implemented in future steps.
Ignored
conglom,
Password provided an ex file and not the source code hence the question.
{quote} Dear Pat.. I would like to request you (and everyone) to follow trading rules mentioned in the first post of this thread. I am following those rules only and can comment on those only. Apart from that I have no experience with other indicators u are trading with. As far as candle length indicator is concern I haven't found any issue with it. Regards
Ignored
Password,
Just read your post. Just to clarify, the indicators on the chart is exactly your strategy. The difference is that you manually draw a horizontal line either a buy or sell depending on the max and min within the look back number of bars and their relative magnitude with respect to each other. The indi you see on the chart shows both, the buy and sell without considering the "magnitude" but does adhere to the look back your strategy calls for. This change allows trading with the trend unlike your concept which is counter trend.
{quote} hi password.. i don't really understand how your trade setup.. i find it interesting but dunno how to choose the bear/bull candle base on DSP.. could you tell us show us why and what are the reason you choose the bull or bear candle??? thanks friend..
Ignored
Hi,
This is very simple. really, you don't need some indicator. But it simplifies the search.
Only find largest candle (body) in the last 96 in M15. This is the DSP.
Also, you need to compare DSP with the largest candle in the other direction. If both candles (body) has similar size, don't trade.
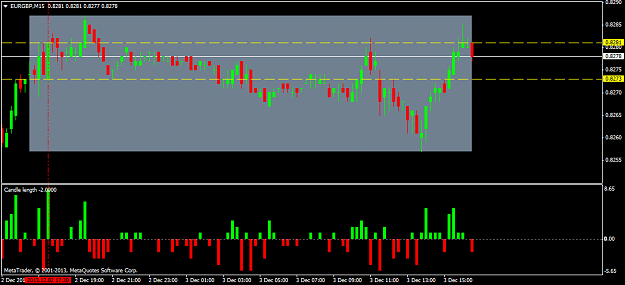
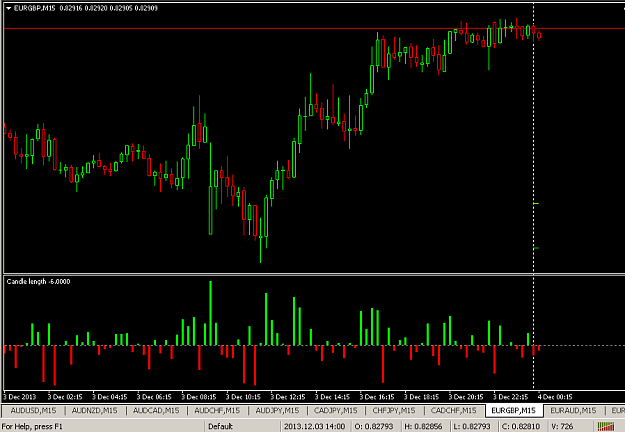
{quote} This candle is different then mine, your is bullish and the gap from somewhere, mine is bearish. Maybe missing some data. {image}
Ignored
Thanks for your clarification ,is it anything to do with broker ?hope password can guide me here,could some kind soul edit this inductor with alert based on highest or lowest DSP candle .
Thankz
{quote} Password, Just read your post. Just to clarify, the indicators on the chart is exactly your strategy. The difference is that you manually draw a horizontal line either a buy or sell depending on the max and min within the look back number of bars and their relative magnitude with respect to each other. The indi you see on the chart shows both, the buy and sell without considering the "magnitude" but does adhere to the look back your strategy calls for. This change allows trading with the trend unlike your concept which is counter trend....
Ignored
Pat, nice indy! That's exactly what I (and I presume most of us) am looking for. It does make life a lot easier, especially if you're looking at multiple pairs. Any chance you will be sharing it?