RANGE 1380.00 - 1410.00
Support Resistance Levels
1 1360.00 1430.00
2 1320.00 1450.00
Overview increasing, marked by low break
at yesterday's session. Conditions continue to watch out for price
potential gold to fall back on the record low
mid-April at 1321.20. When observed from the pattern
movement over the last month, it appears that the line
20-day moving average resistance enough to be valid
to curb the chances of a rally that may in
recur.
S2 S1 Pivot Point R1 R2
1355.68 1370.86 1384.58 1399.77 1413.48
INDICATOR VALUE
Stoch (14) ↓ 11
RSI (14) ↓ 33
MACD (9) ↓ -20
PAR SAR (9) ↑ 1488.00
EMA (20) ↓ 1453.32
EMA (50) ↓ 1501.71
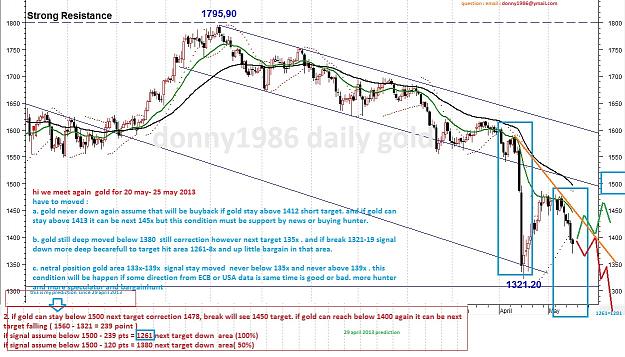
which one? 1350? or 1280? seharusnya bulan juni udah naik emasnya... cyprus jual 40 ton emas , langsung drop ke 1322 , 15 mei ETF holdings jual emas, langsung open gab dari 1403 ke 1398... trus turun sampe jumat ke 1355... berita penjualan emas yg terakhir cuma ETF holding... menjelang ramadhan nih bulan depan...
which one? 1350? or 1280? seharusnya bulan juni udah naik emasnya... cyprus jual 40 ton emas , langsung drop ke 1322 , 15 mei ETF holdings jual emas, langsung open gab dari 1403 ke 1398... trus turun sampe jumat ke 1355... berita penjualan emas yg terakhir cuma ETF holding... menjelang ramadhan nih bulan depan...
Ignored
kalo menurut saya emas akan kebawah sekali lagi dan akan netral menjelang ramadan area 1400an-1500 . etf mengurangi kepemilikan di ikuti soros
CORNER ANALYSIS
1390.00 - 1410.00
S1
1386.30
Support
1380.00
1360.00
Pivot Point
1391.55
Medium Neutral
Resistance
1420.00
1440.00
R1 R2
1399.40 1404.65
Long
Bearish
Index was rangebound under 1400 as well as a fairly strong resistance to breached since a week ago. Hope the recovery is expected to immediate resistance at 1430's (supreme Dec 2010). For 1 or 2 days is not met, signaling the possibility of pressure will still dominate and the opportunity to return to the low levels of 1321 last month remains open. Of the medium trend, gold is expected in the neutral cue towards bearish.
INDICATOR
STOCH (14) ↓ RSI (14) ↑
VALUE
30
39 MACD (9) -27 ↑
CORNER ANALYSIS
1390.00 - 1410.00
S1
1383.42
Support
1380.00
1360.00
Pivot Point
1389.38
Medium Neutral
Resistance
1420.00
1440.00
R1 R2
1399.27 1405.23
Long
Bearish
There is no
Possibility rangebound session is still going on today, for the 4th time in a row, which generally does not reflect the trend trend. However, the fall in early May to the area 1340s, encouraging a short-term bearish trend. Note the illustration above, the trendline will still likely be a support and resistance in some future period. If 1400 penetrated, then resistance will be seen nearby.
change
fundamental
on
session yesterday.
CORNER ANALYSIS
1390.00 - 1410.00
S1
1394.80
Support
1380.00
1360.00
Pivot Point
1406.40
Medium Neutral
Resistance
1420.00
1440.00
R1 R2
1424.50 1436.10
Long
Bearish
Although he has climbed to the highest in the last 2 weeks, the area of early 1415, the character gains seen limited. Prices tend to still hovering in the area in 1400. Even so, the possibility is still not enough to define a strong bullish for the short-term. Need a strong indicator as surpass 1420's level so that trends can be observed more clearly. Key support is now expected late 1376 levels, which is the point of the trendline since the end of 2011. Beware if it penetrated.
INDICATOR
STOCH (14) ↑ RSI (14) ↑
VALUE
46
CORNER ANALYSIS
1370.00 - 1400.00
S1
1374.16
Support
1360.00 1340.00
Pivot Point
1398.03
Medium
Neutral
Resistance
1420.00
1440.00
R1 R2
1411.56 1435.43
Long
Bearish
Last week gold closed by removing the gains achieved on Thursday to surpass the level of 1400 again. This indicates the possibility of losing early momentum. However, the effort of gold to rise relatively strong, it is likely to exist sehngga on the psychological level. Level of concern is 1370.80 which if breached, the minimum today, then gold likely to fall further, the assumption in the 1350s. Meanwhile, the medium-term signals are still confirming bearish.
INDICATOR
STOCH (14) ↑
RSI (14) ↓
VALUE
53 42
MACD (9) -23 ↑
PAR SAR (9)
EMA (20)
EMA (50)
↓ ↓ 1339.50 1388.96 1464.43 ↓
CORNER ANALYSIS
1370.00 - 1400.00
S1
1366.70
Support
1360.00 1340.00
Pivot Point
1392.35
Medium
Neutral
Resistance
1420.00
1440.00
R1 R2
1407.40 1433.05
Long
Bearish
At this week it expects gold to move sideways as seen from the 3rd week of the period of May and try to survive in the 1400s the area any longer. Nevertheless, some positive catalysts that will affect the price of gold will likely not change the short-term trend is currently bearish position. Gold also has a chance to recover, but perhaps a bit limited and must be tested resistant like 1430's and 1480's at maximum. This week is expected to range between 1360-1410's.
INDICATOR
STOCH (14) ↓
RSI (14) ↓
VALUE
71 43
CORNER ANALYSIS
1360.00 - 1390.00
S1
1366.87
Support
1340.00
1320.00
Pivot Point
1376.83
Medium Neutral
Resistance
1400.00
1420.00
R1 R2
1388.06 1398.03
Long
Bearish
Predicted no changes outlook on today's session, where the atmosphere is relatively still looming bearish movement in the price of gold this week into the second period. Meanwhile, assuming limited sideways deemed to have failed because there has been a break-low for the 3rd time. Expectations for positive catalysts will likely be delayed. Despite trying to recover, expected to regain lost momentum. Immediate support is likely to be tested remains, namely at the level of the 1360s.
INDICATOR
STOCH (14) ↓ RSI (14) ↓
VALUE
39
42 MACD (9) ↓ -13
PAR SAR (9) EMA (20) EMA (50)
↑ ↓ 1364.08 1400.57 1442.40 ↓
RANGE Level 1
2
S2
1363.67
Short
CORNER ANALYSIS
1370.00 - 1400.00
S1
1373.933
Support
1360.00
1340.00
Pivot Point
1384.47
Medium Neutral
Resistance
1420.00
1440.00
R1 R2
1394.73 1405.27
Long
Bearish
Bearish
As in the previous outlook exposure that although gold prices to try to recovery, is expected to potentially lose momentum. While the bearish cues were confirmed since the prices are not able to survive in the end of 1420 last week, may still be looming in the gold price movement into the 4th period this week. Support today is the 1385's. When tested again, the price is likely to enter the range of 2 previous period. But if on the contrary, essential level in 1400 may soon be tested.
INDICATOR VALUE
STOCH (14) RSI (14)
↓ 34
↓ 44 MACD (9) -12 ↑
In this week expected to still be going sideways, with a range of expectations in the 1360s up to 1400, which was based on the pattern since the end of May to the last week. Nevertheless, the atmosphere tends to be a strong bearish so that it could be the price of gold will lose the positive momentum when trying to crawl up. Fundamentally, gold participants may still focus on the U.S. central bank's policy measures related to monetary stimulus as well as the tension in the middle easterners (Syria).
Estimates that in the week gold will move sideways possibility. So despite trying to test 1400 resistance might come back and lose the positive momentum back to the flat area (with the 38.2% Fibonacci retracement of scale as its track). However, especially for the price signals in the short-term trend is still bearish and will be confirmed if 1360 broken back. Of the fundamental aspects, 2-day FOMC meeting will be the main focus and passionate mjd U.S. equities.
Last week was recorded to be the worst week of the 3rd drop
Global gold prices so far this year. based on data
Historically, the gold is also likely to recover at least
70 per cent of the total correction, to a position roughly 1340s prices
(note the decrease in April and May). it could
fulfilled when the price is able to break-out resistance is now at
1310's. Still, watch out for cues
grow strong bearish, specifically short and medium-term, which
opens the possibility of testing a trendline support nearby.
Be careful, bearish cues predicted very strong. This one caused the closing gain of rebound at the end of last week. If the break-low, then it is possible to achieve immediate support as well, such as the relative level of 1265 or early 1226 at the furthest.
If expectations are met, this phenomenon can be assumed as the downtrend in particular for the long term. Although it would appear the recovery, is likely to remain limited or losing momentum. An estimated fair price (fair value) to get in on the global gold range below 1150.
Last week the price of gold recorded its worst weakness 3rd
at least this year. It was not until a month he had
Corrections posted a cumulative 210 basis points more intensively.
Indications are likely to reinforce an idea
negative in this week, though prices rebound over
resistant 1227 back last Friday. However, the rebound
still not enough to change the picture or atmosphere
bearish lately. Remain to be addressed carefully in the middle of the price
which tends lost confidence. Meanwhile, the assumption
jg fair value does not change, remain in the area under the 1170's.
Predicted no change in outlook, where this week, although there is an increase (following a rebound Friday) is limited possibility weakening its worst post-gold record at least the 3rd round this year and did not even get a month he has posted a cumulative correction of 200 points more intensively. The rebound is still not enough to change the bearish picture until the end of this week. Remain to be addressed carefully in the middle price tends lost confidence. Meanwhile, the assumption of unchanged fair value jg, remain in the area under the 1150's.
Target is expected to increase continuously in the position early in the beginning of 1280 this week, while the overall outlook has not changed fundamentally in which such increases could be limited following the subs gain 2 consecutive terms. Remain to be addressed carefully in the middle price tends lost confidence after the price correction has posted a cumulative 200 basis points more intensively and a decrease in the worst phase of the 3rd round this year. On the other hand, the rebound is still too early to describe the potential price of the bullish phase.