RANGE 1590.00 - 1610.00
Support Resistance Level
1 1580.00 1620.00
2 1560.00 1640.00
Nearest resistance level is finally penetrated the
continuation of its technical rebound. Gold is expected to
defines bullish for the short-term, after the level of 1600
(previously also become an important support), penetrated.
However, a confirmed bearish atmosphere since
sharp decline in early February remains to be seen.
Projections for the medium-term decline, the 1520s (the
arrows) may still not open for sentiment
enough to restore confidence in gold. Or is there a possibility
rally will be held at the 1600 level.
S2 S1 Pivot Point R1 R2
1570.13 1592.06 1606.13 1628.06 1642.13
MARKET DATA
DATE OPEN HIGH LOW CLOSE + / - $
25/02/2013 1580.15 1597.00 1574.80 1594.30 +14.60
26/02/2013 * 1592.50 1620.20 1584.20 1614.00 19.70
INDICATOR VALUE
STOCH (14) ↑ 31
RSI (14) ↑ 43
MACD (9) -20 ↑
PAR SAR (9) 1624.59 ↓
EMA (20) ↓ 1618.88
EMA (50) ↓ 1654.48
CORNER ANALYSIS
1590.00 - 1610.00
S1
1587.50
Support
1580.00
1560.00
Pivot Point
1601.15
Medium
Bearish
Resistance
1620.00
1640.00
R1 R2
1610.30 1623.95
Long Neutral
Post penetrate important resistance 1600 the day before yesterday, a bullish signal for the short-term relative possibility still exists. Nearest resistance is now likely to be tested is that the level of 16 350's. However, the positive sign is expected to overshadow bearish atmosphere after a sharp decline in early February, the strength can be balanced. When 1600 passed again, it can be assumed gold losing momentum. Note the pattern of the period June 2012 and, in 1635 gold hit first and fell back through the 1600 return.
INDICATOR
STOCH (14) RSI (14) MACD (9) PAR SAR (9) EMA (20) EMA (50)
VAL UE
↑ ↑ 37.59 38.74 -20.26 ↓ ↓ ↓ 1620.20 1621.74 1650.13 ↓
AkhirXAUUSD
Hari Ini today
60% Sell50% Sell100% Sell72% Sell-6.06 / -0.38%
Analisa Teknikal Short Term: 1-7 Hari)60% Sell
trendspottersell
7 day average directional indicatorsell
10-8 day MA hilo channelhold
20 day MA VS Pricesell
20-50 Day MACD oscillatorsell
20 Day Bollinger Bandshold
Analisa Teknikal (Mid Term: 2-4 Minggu)50% Sell
40 Day commodity channel indexsell
50 Day MA VS Pricesell
20-100 Day MACD oscillator
sell
50 Day parabolic time/pricebuy
20-50 Day MACD oscillatorsell
Analisa Teknikal Long Term: 1-3 Bulan)100% Sell
60 Day commodity channel indexsell
100 Day MA VS Pricesell
50-100 Day MACD oscillator
-
CORNER ANALYSIS
1570.00 - 1590.00
S1
1568.20
Support
1560.00
1540.00
Pivot Point
1585.60
Medium
Bearish
Resistance
1610.00
1625.00
R1 R2
1596.70 1614.10
Long Neutral
It should be noted that the movement of the gold price looks volatile, amid bearish signals from a sharp fall in early February. Although after that followed by technical rebound exceed 1600. This phenomenon usually tend to be inconsistent for a while. Technically, if the price is not able to hold above the 1600 support, it could be potentially sideways and the price of gold could lose momentum again. If you look at the pattern of past periods June 2012 152x, gold hit a new 1635 first and fell back through the 1600 return.
INDICATOR
STOCH (14) RSI (14) MACD (9) PAR SAR (9) EMA (20) EMA (50)
VAL UE
34.73 35.02 ↓ ↓ ↓ ↓ 1617.78 1620.20 -20.90 ↓ ↓ 1647.39
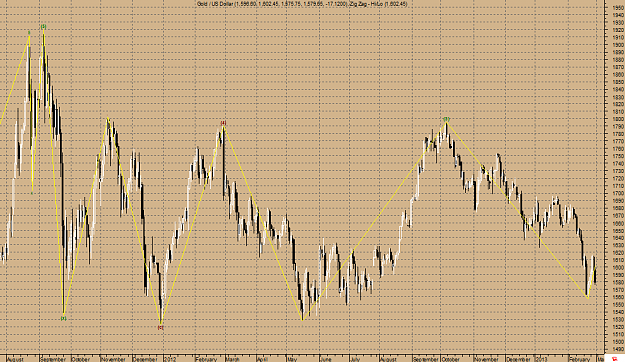
XAU/USD DAILY as of Friday, 01 March, 2013 Wave 4 of moderate (13%) amplitude has crossed a threshold where the probability of a failure is higher. This wave could turn into an impulse wave 1 of opposite trend. The present wave patterns are: fast amplitude (8%): bearish wave 1 moderate amplitude (13%): bullish wave 4 Gold / US Dollar is long term Bearish as the 144 days moving average of 1,669.25 is decreasing. The Relative Strength Index is at 35.09 in the neutral territory. The Relative Momentum Index is at 23.05 in the oversold territory. An important indicator for Elliott waves, the Elliott oscillator is at -44.63, in negative territory; this is a bearish sign. An equally important indicator, the STORSI is at 81.09. This value is in the overbought territory.
IndicatorValueAction
BID PRICE1567.350000NA
SIMPLE MA 51572.000000SELL
SIMPLE MA 101575.570000SELL
SIMPLE MA 201577.990000SELL
SIMPLE MA 501590.295000SELL
SIMPLE MA 1001594.244500SELL
EXPONENTIAL MA 51571.129065SELL
EXPONENTIAL MA 101574.304342SELL
EXPONENTIAL MA 201578.584210SELL
EXPONENTIAL MA 501586.451516SELL
EXPONENTIAL MA 1001590.568006SELL
RSI 1427.347305OVERSOLD
STOCHASTIC 5,3,321.709234OVERSOLD
PARABOLIC SAR 0.02/0.21582.313440SELL
MACD 12,26,9-5.489193SELL
WILLIAM %R 14-84.408602SELL
S1S2S3PivotR1R2R3
1540.18331557.36671568.28331585.46671596.38331613.56671624.4833
Last Updated at : 2013-03-01 18:59:57
DISCLAIMER:
* Updated Hourly
* This is NOT a trading recommendation
.
NEWS
Gold fell as the dollar strengthened after U.S. economic data
including consumer spending, consumer confidence and
factory activity all point to increased growth
economy. Some investors believe the U.S. outlook could be better
encourage the Federal Reserve to stop earlier stimulus
than expected.
Gold is still weak because the U.S. government will start
federal government cut spending in all departments, which
known as "sequestration," which threatens inhibit
economic recovery, after President Barack Obama and his
Congressional leaders failed to find an alternative budget plan.
ANALYSIS
Since the price of gold fell and penetrated the back of 1600, signaling
short-term changes expected due to the level of the neutral
still relevant enough to detect signal strength, either
when up or down. As with exposure to outlook
previously that volatile gold prices seen in the middle
shadow bearish since the sharp fall in early February.
Even after it was followed by a technical rebound. phenomena
This usually tends to be inconsistent for a while.
Technically, because the price is far below 1600 (intraday-low
1560s) can be projected to the 1520 support back open.
CORNER ANALYSIS
1550.00 - 1598.00
S1
1567.03
Support
1540.00
1520.00
Pivot Point
1575.97
Medium
Bearish
Resistance
1580.00
1600.00
R1 R2
1582.83 1591.77
Long Neutral
Gold prices seem limited in initiating moves rangebound this week. However, it remains to be seen as a bearish signal is relatively strong and has the potential to catch the nearest support in 1560s. As with previous exposure to the gold price outlook seen volatile amid bearish shadow from a sharp fall in early February. Even after it was followed by a technical reflection. This phenomenon is usually not consistent for a while time. Since the price falls lead to an intraday-low 1560s, may support the results projected in 1520 re-opened position.
CORNER ANALYSIS
1560.00 - 1580.00
S1
1569.00
Support
1540.00
1520.00
Pivot Point
1577.75
Medium
Bearish
Resistance
1600.00
1620.00
R1 R2
1584.00 1592.75
Long Neutral
Although positive probability not change the picture presented in the outlook yesterday. Character gold prices remains to be seen as a bearish signal is relatively strong and has the potential to catch the nearest support in 1560s. And lately seen volatile gold prices amid bearish shadow from a sharp fall in early February. Even after it was followed by a technical reflection. This phenomenon is usually not consistent for a while time. Since the price falls lead to an intraday-low 1560s, may support the results projected in 1520 re-opened position.
INDICATOR
STOCH (14) RSI (14) MACD (9) PAR SAR (9) EMA (20) EMA (50)
VAL UE
↓ ↓ 20:45 34.37 -21.85 ↓ ↓ ↓ 1601.22 1606.59 1639.16 ↓
strategi buy on dip
market slow on sideways
if break below 1553-55 this strategi is failed
CORNER ANALYSIS
1560.00 - 1580.00
S1
1572.20
Support
1540.00
1520.00
Pivot Point
1578.60
Medium
Bearish
Resistance
1600.00
1620.00
R1 R2
1590.00 1596.40
Long Neutral
Gold moves rangebound at least in the last 4 periods. Character gold prices remains to be seen as a bearish signal is relatively strong and the possibility of a chance to catch the nearest support in 1560s. In the middle of increased volatility and bearish shadows fall sharply since early February, the gain can be expected to occur successfully recorded reduced. This phenomenon is usually not consistent for a while. Meanwhile, since the price falls lead to intraday-low 1560's, was opened in 1520 a chance to support the projected widening. but the area is bound to 159x
INDICATOR
STOCH (14) RSI (14) MACD (9) PAR SAR (9) EMA (20) EMA (50)
VAL UE up
↑ ↑ 24.87 38.25 -20.88 upbsignal ↑ ↓ ↓ 1595.62 1604.45 1637.00 ↓
buy on dip strategy
Sideways trend still
nb update hours
__________________
PM for question.
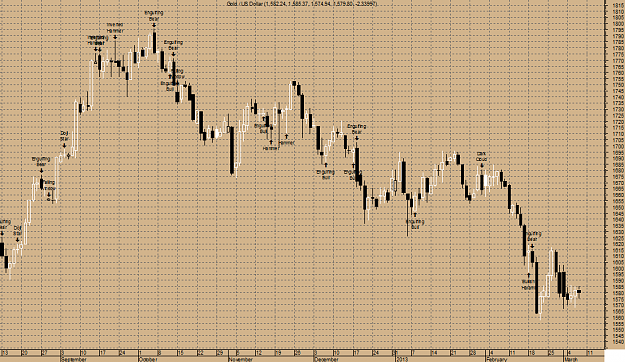
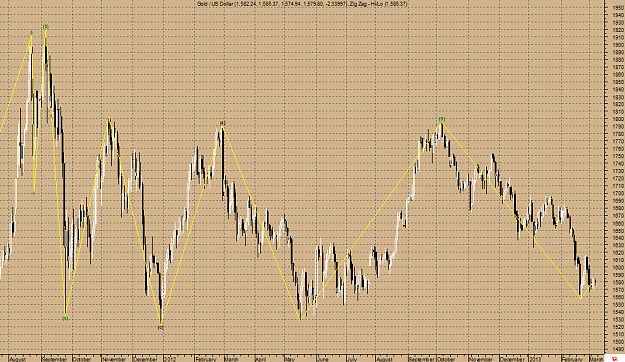
XAU/USD DAILY as of Friday, 08 March, 2013 A Daily black body has formed (because prices closed lower than they opened). For the past 10 Daily candlestick bars as of 07/03/13, there are 5 white candles versus 5 black candles. For the past 50 Daily candlestick bars as of 07/03/13, there are 24 white candles versus 26 black candles with a net of 2 black candles. A Daily spinning top has formed (a spinning top is a candle with a small real body). Spinning tops identify a session in which there is little price action as defined by the difference between the open and the close. During a rally or near new highs, a spinning top can be a sign that prices are losing momentum and the bulls may be in trouble. Wave 4 of moderate (13%) amplitude has crossed a threshold where the probability of a failure is higher. This wave could turn into an impulse wave 1 of opposite trend. The present wave patterns are: fast amplitude (8%): bearish wave 1 moderate amplitude (13%): bullish wave 4 Gold / US Dollar is long term Bearish as the 144 days moving average of 1,663.14 is decreasing. The Relative Strength Index is at 36.86 in the neutral territory. The Relative Momentum Index is at 19.64 in the oversold territory. An important indicator for Elliott waves, the Elliott oscillator is at -39.28, in negative territory; this is a bearish sign. An equally important indicator, the STORSI is at 61.64. This value is in the neutral territory. Elliott Waves High Volatility has detected an Isolated Low at 1,567.79 one bar ago; this is usually a bullish sign
CORNER ANALYSIS
1560.00 - 1580.00
S1
1573.56
Support
1540.00
1520.00
Pivot Point
1579.53
Medium
Bearish
Resistance
1600.00
1620.00
R1 R2
1584.47 1590.43
Long Neutral
Almost no change, moving gold rangebound into period-5. Character gold prices remains to be seen as a bearish signal is relatively strong and the possibility of a chance to catch the nearest support in 1560s. In the middle of increased volatility and bearish shadows fall sharply since early February, the gain can be expected to occur successfully recorded reduced. This phenomenon is usually not consistent for a while. Meanwhile, since the price falls lead to intraday-low 1560's, was opened in 1520 a chance to support the projected widening. up targetvarea 1584 and 1596
INDICATOR
STOCH (14) RSI (14) MACD (9) PAR SAR (9) EMA (20) EMA (50)
VAL UE
↑ ↑ 30.34 36.73 -20.34 ↓ ↓ ↓ 1590.70 1601.93 1634.69 ↓
Neutral
RANGE 1560.00 - 1588.00
Support Resistance Level
1 1540.00 1600.00
2 1520.00 1620.00
This week there is no change in the range of possibility, gold
opportunity to move rangebound for period-6.
Character gold prices remains to be seen as a bearish signal
is still relatively strong and also have an opportunity to pursue support
Closest 1560s. In the middle of increased volatility and
shadow bearish since the sharp fall in early February, the gain
were successfully recorded is expected to be reduced. while
Therefore, since the price falls lead to an intraday-low 1560's, it
chance to support the projected opening in 1520 has widened. assumptions
short-term rebound in the 1550s remain.
S2 S1 Pivot Point R1 R2
1551.76 1565.03 1574.46 1587.73 1597.16
MARKET DATA
DATE OPEN HIGH LOW CLOSE + / - $
07/03/2013 1583.85 1585.50 1574.60 1578.50 -5.10
08/03/2013 * 1578.05 1583.90 1561.20 1578.30 -0.20
INDICATOR VALUE STOCH (14) ↑ 35 up
RSI (14) ↓ 36 down
MACD (9) -19 ↑ up
PAR SAR (9) 1586.37 ↓
EMA (20) ↓ 1583.77
EMA (50) ↓ 1641.66
11-03-2013
gold still range sideways strategi
buy on dip
sell on high
If gold take 1587-88 sell and TP 1-5 POINT, BUT IF BREAK 1590-91 WILL BE SEE TARGET 1596-98 AND THEN WILL BE DOWN AGAIN SELL
DOWN SIGNAL AREA SEE IN 1563 TARGET 1553
IF GOLD DOWN TO 155X BUY AND HOLD FOR SHORT TP 1-10 PTS
UPDATE NEWS NEED
RANGE 1560.00 - 1598.00
Support Resistance Level
1 1540.00 1600.00
2 1520.00 1620.00
In the third period there is no possibility of change analysis
including support and resistance and daily range today.
And also the possibility of this condition will last until
the end of this week. Expected to remain fairly bearish signal
robust that it can open up opportunities for achieving support
Closest 1560s. Daily Volatility above average and the signal
tends to overshadow bearish price movement and
would inhibit lajut rise. Since the price falls lead
intraday-low 1560's, it makes getting support 1520
wide open.
S2 S1 Pivot Point R1 R2
1571.32 1581.93 1590.22 1600.83 1609.12
MARKET DATA
DATE OPEN HIGH LOW CLOSE + / - $
11/03/2013 * 1578.30 1583.35 1575.10 1581.50 +3.20
12/03/2013 * 1581.70 1598.50 1579.60 1592.55 +11.05
INDICATOR VALUE
STOCH (14) ↑ 44.99
RSI (14) ↑ 43.95
MACD (9) -16.85 ↑
PAR SAR (9) 1554.60 ↓
EMA (20) ↓ 1597.44
CORNER ANALYSIS
REVIEWS
Short Medium Long
Neutral Neutral Bearish
RANGE 1570.00 - 1595.00
Support Resistance Level
1 1560.00 1600.00
2 1540.00 1620.00
Mid week gold seemed to indicate
best performance, though likely still experiencing
barriers. There is a possibility of this condition will last until
the end of this week and the level in 1600 was just a test.
On the other hand, expected to be a bearish signal is strong enough that
any time can turn things around. Daily Volatility in
above average, achieving high-low is usually taken in
relatively short time. It should be noted also, since the price
falls lead intraday low 1560s-early February last
did make medium-trend remains bearish.
S2 S1 Pivot Point R1 R2
1576.92 1582.53 1591.02 1596.63 1605.12
MARKET DATA
DATE OPEN HIGH LOW CLOSE + / - $
12/03/2013 * 1581.70 1598.50 1579.60 1592.55 +11.05
13/03/2013 * 1593.00 1599.50 1585.40 1588.15 -4.40
INDICATOR VALUE
STOCH (14) ↑ 48.26
RSI (14) ↓ 42.31
MACD (9) -15.56 ↑
PAR SAR (9) 1555.48 ↑
EMA (20) ↓ 1596.55
EMA (50) ↓ 1627.39