JR, love your approach and wanted to show this, as I was quite impressed by it and it fits in nicely with the theme of this thread.
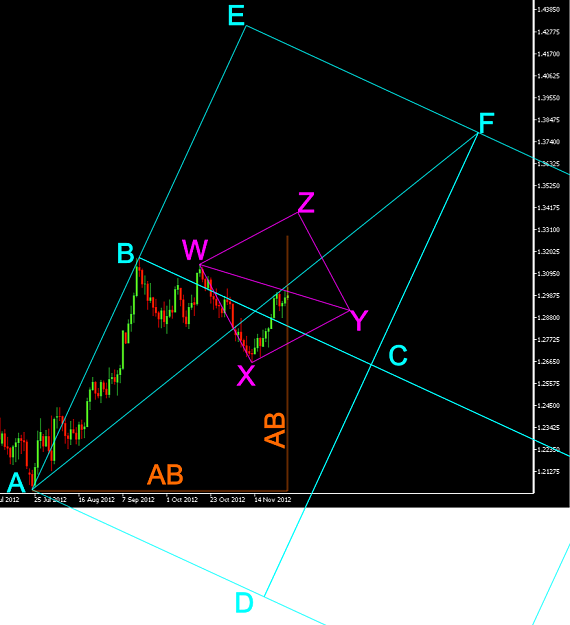
Looking at a 4hr chart of EurUsd...
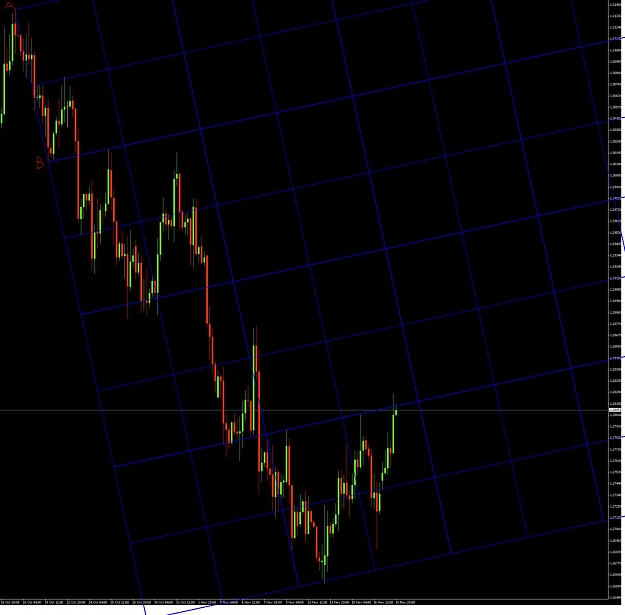
The initial downward impulse I labeled AB. That impulse was used to create the grid shown above
Each square is .5ABx.5AB
You will notice how price responded many times to the various support and resistance, including marking the ultimate low almost to the pip.
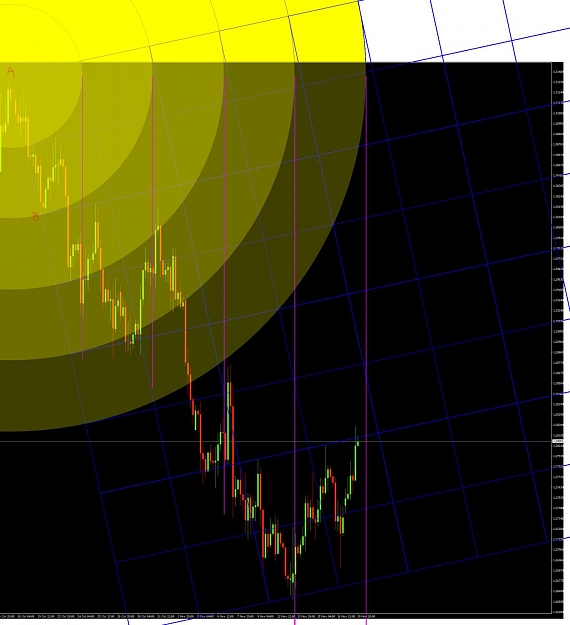
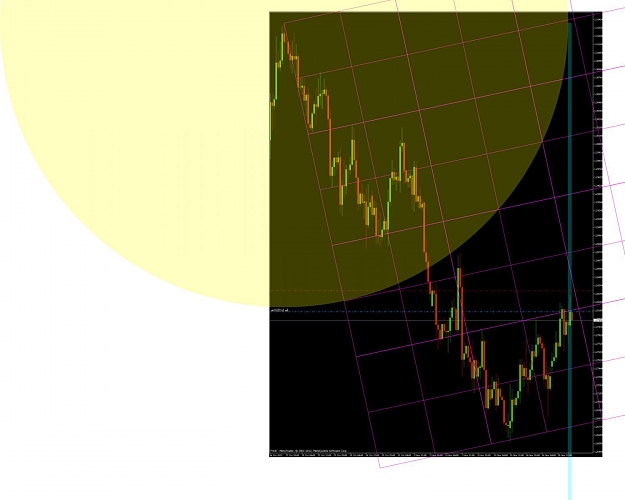
Taking the grid, I then centered concentric circles, all centered at the high (pointA)
The smallest circle is radius .5AB and each circle is radius .5AB bigger than the last
Each magenta line is tangent to each circle's rightmost point.
These all marked major swing times within a bar or 2. (especially the ones of radius AB and 2AB, the major ones, the .5 ones being minor ones)
The most amazing thing is price hit the 4th AB price line at the 2AB circle time, EXACTLY. [2x1 of pricetime? ]
]
We have 2.5AB time coming up soon, with price hugging the 3rd AB price line, will be interesting to see if it causes a decline
Dolemite
Looking at a 4hr chart of EurUsd...
Attached Image (click to enlarge)
The initial downward impulse I labeled AB. That impulse was used to create the grid shown above
Each square is .5ABx.5AB
You will notice how price responded many times to the various support and resistance, including marking the ultimate low almost to the pip.
Attached Image (click to enlarge)
Taking the grid, I then centered concentric circles, all centered at the high (pointA)
The smallest circle is radius .5AB and each circle is radius .5AB bigger than the last
Each magenta line is tangent to each circle's rightmost point.
These all marked major swing times within a bar or 2. (especially the ones of radius AB and 2AB, the major ones, the .5 ones being minor ones)
The most amazing thing is price hit the 4th AB price line at the 2AB circle time, EXACTLY. [2x1 of pricetime?
We have 2.5AB time coming up soon, with price hugging the 3rd AB price line, will be interesting to see if it causes a decline
Dolemite