-----------------------------------------------------------------------
this is my
INDICATOR VALUE (six)
example today
STOCH (14) ↑ 88.36
RSI (14) ↑ 69.80
MACD (9) ↑ 23.38
PAR SAR (9) ↑ 1602.30
EMA (20) ↑ 1600.03
EMA (50) ↑ 1578.47
Ignored
I don't quite get your indicator meaning like STOCH(14)?
Hehe. if you lost only one time half of your investment, you're very very good
I'm a common trader, so i burned 3 or 4 accounts ( with very small amounts, but still ), took crazy over-leverage, etc..etc.. all traders smile when they read this... i know
Now more quiet, we all know the key is money management , whatever we do with our trades
Ignored
nah...
lost half with multiple transactions. was chasing the market most of the time so i ended up buying high and selling low haha
i got back most of what i have lost though. i just had to unlearn some bad habits
i've read 200 times it would go down if there was dollar buying !
looks strange to me, or is it just technical ? ( going to a level to plunge ?)
any view would be apreciated
i like to understand
Ignored
I think
1. certainty vote has not been fully make sure investors are willing to switch from gold.
decision to increase the debt limit is still in the planning stages with some stages going forward.
2. Oil rose to an area 97 and the buyer retains the position of traders buy
3. USA bad data
yeah that was my reaction also. that's when i realized i cannot rely only on fundamentals alone when trading. after losing half of my investment i decided to read as much as i can on technical analysis and visit forums like this. i cannot also rely purely on technicals, because gold most of the time can be very sensitive to economic news... if only i realized this sooner
INDICATOR VALUE
STOCH (14) ↓ 87.52
RSI (14) ↓ 66.07
MACD (9) ↓ 23.03
PAR SAR (9) ↑ 1602.30
EMA (20) ↑ 1603.74
EMA (50) ↑ 1584.63
RANGE today moved 1610.00 – 1640.00
Support Resistance
1 1600.00 1650.50
2 1575.30 1680.00
Short Medium Long ----------S2 S1 Pivot Point R1 R2
Bullish Bullish Bullish 1594.30 1606.70 1619.30 1631.70 1644.40
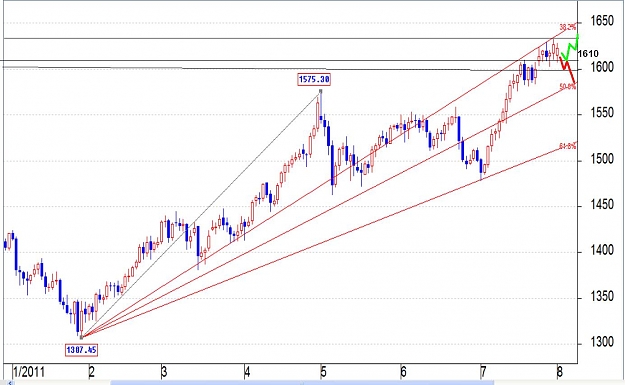
* Prices shown are still firmly in position (steady), meaning that the indication
possible bullish trendline resistance remains strong with 38.2% Fibonacci
Fan (top) to test its strength. If would have
correction, estimated to be only limited and relatively restrained in the area above the
The 1600s.
* The indication above do not rule out going to happen recordbreaking
advanced. Once this happens, at least this week, then this rally
can be sustained until the following weeks. Some analysts
predict, there are times when the price will be overbought, but still
visible
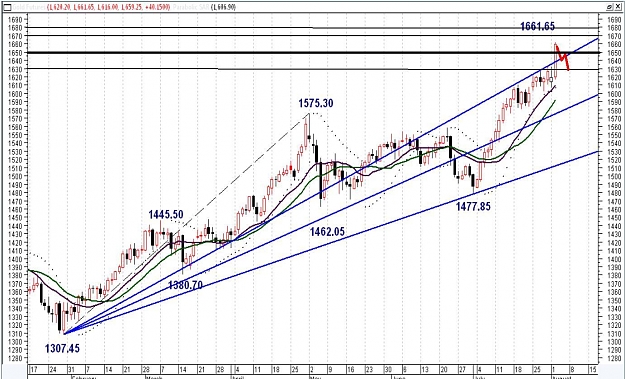
i think
today if gold stay around 1615 it will be down to 1610-1609 to S1(1606)
if gold stay in area 1618-1621 it will be up to 1625 and to R1 (1631)
INDICATOR VALUE
STOCH (14) ↓ 87.52
RSI (14) ↓ 66.07
MACD (9) ↓ 23.03
PAR SAR (9) ↑ 1602.30
EMA (20) ↑ 1603.74
EMA (50) ↑ 1584.63
RANGE today moved 1610.00 – 1640.00
Support Resistance
1 1600.00 1650.50
2 1575.30 1680.00
Short Medium Long ----------S2 S1 Pivot Point R1 R2
Bullish Bullish Bullish 1594.30 1606.70 1619.30 1631.70 1644.40
* Prices shown are still firmly in position (steady), meaning that the indication
possible bullish trendline resistance remains strong with 38.2% Fibonacci
Fan (top) to test...
in this situation gold is still strong up. fundamental is no 1.
if gold untill close gold in area 1635 it will strong bullish for tomorrow target 1650 (overbougth)
if gold is back to area open gold 162x it will be bullish to 163x agains and whenever can down to 1619-161x
if gold closed today in area below 1620 it will be bearsih short term to 1610-1605
good postition take sell in higher gold take profit $3-$7.
and buy position in lower today taking profit $5-$7
look my prediction today resistance is 1640
and the next target is 1650 75%
-------------------------------------------------------------------------------------------------------
but anyway this week is very risky to always buy gold at higher prices. Gold could fall anytime.
today until tomorrow were likely to rise very high. but the saturation of investors on day 3 could happen. cautious in the transaction. maybe George Soros sold gold again hehe
Senate expected to pass debt plan, end crisis Tuesday
Washington (CNN) -- The U.S. Senate is scheduled to vote on a last-minute compromise plan to raise the nation's debt ceiling Tuesday, imposing sweeping new spending cuts while narrowly averting a national default and potential economic catastrophe at the last possible moment.
Senators are set to vote on the plan around noon. While the bill requires a supermajority of 60 votes to clear the 100-member chamber, it is expected to be easily approved.
The measure was approved by the House of Representatives on Monday by a 269-161 vote, overcoming opposition from unhappy liberal Democrats and tea party Republicans. Money: What's in the bill
The measure needs to be signed into law by President Barack Obama before the end of the day. If the current $14.3 trillion debt limit is not increased by that point, Americans could face rapidly rising interest rates, a falling dollar and shakier financial markets, among other problems.
Even if the measure passes, however, the federal government could still face a credit rating downgrade. http://edition.cnn.com/video/bestoft...nn.640x360.jpg
Tea party goes from 'Hobbits' to winners iReport: Share your message with Congress
The agreement -- reached Sunday by Obama and congressional leaders from both parties -- calls for up to $2.4 trillion in savings over the next decade, raises the debt ceiling through the end of 2012 and establishes a special congressional committee to recommend long-term fiscal reforms.
Emotions have run high during the final debates on Capitol Hill. Numerous Republicans remain worried about cuts in defense spending and the lack of a required balanced-budget amendment to the Constitution. Progressive Democrats are livid over the extent of the deal's domestic spending cuts, as well as the absence of any immediate tax hikes on wealthier Americans.
This "may be the single worst piece of public policy to ever come out of this institution," liberal Rep. Maxine Waters, D-California, declared Monday. House Minority Leader Nancy Pelosi, D-California, noted that the measure "makes these big cuts and has ... not one red cent from the wealthiest people in our country -- no revenue."
Speaker John Boehner, R-Ohio, and other GOP leaders told rank-and-file Republicans the deal would start reshaping how Washington spends taxpayer money, which was the goal of conservatives who fueled the GOP takeover of the House in last year's midterm elections.
"The bill is not perfect ... but changing the way that Washington spends taxpayers' dollars is often a lot like redirecting or turning an aircraft carrier," said House Majority Leader Eric Cantor, R-Virginia. "It's a monumental task."
Boehner acknowledged Monday that a number of Republicans -- particularly those on the powerful Armed Services Committee -- were concerned about cuts to military spending in the agreement, but he told reporters he believed they would support the proposal.
"I told them this is the best defense number we're going to get, and frankly if we don't pass the bill, it's pretty clear to me what'll happen ... the defense number will go down," Boehner said.
In the end, Boehner was able to round up the support of most of his GOP caucus, while the chamber's two top Democrats -- Pelosi of California and Minority Whip Steny Hoyer of Maryland -- voted for the plan along with more than 90 of their caucus members.
One of those supporting the plan was Rep. Gabrielle Giffords, D-Arizona, who cast her first House vote since being shot in the head in an assassination attempt in January. She received an emotional ovation when she entered the chamber.
The final agreement revolves around a two-stage process.
The first stage includes $917 billion in savings, including a roughly $420 billion reduction in the national security budget. The cuts would be accompanied by a $900 billion increase in the debt ceiling.
Because of the pending Tuesday deadline, Obama would have immediate authority to raise the debt ceiling by $400 billion, which will last through September, according to the White House.
The other $500 billion increase in the debt limit would be subject to a congressional vote of disapproval that can be vetoed by Obama.
In the second stage, a special joint committee of Congress would recommend further deficit reduction steps totaling $1.5 trillion or more, with Congress obligated to vote on the panel's proposals by the end of the year.
The committee would comprise 12 members: Six from each chamber, equally divided between Democrats and Republicans. The panel's recommendations would be due by November 23 and guaranteed an up-or-down vote without amendments by December 23.
The committee is expected to consider politically sensitive reforms to the tax code and entitlement programs, though Democrats and Republicans disagree on the likelihood of any eventual revenue increases.
If the committee's recommendations are enacted, Obama would be authorized to increase the debt ceiling by up to $1.5 trillion. If the recommendations are not enacted, Obama can still raise the debt ceiling by $1.2 trillion. At that point, however, a budget "trigger" would kick in, imposing mandatory across-the-board spending cuts matching the size of the debt ceiling increase.
The cuts would be split between defense spending and non-defense programs, an unpopular formula intended to motivate legislators to approve the committee's recommendations.
"You want to make it hard for (lawmakers) just to walk away and wash their hands," Gene Sperling, the director of Obama's National Economic Council, said Sunday. "You want them to say, if nothing happens, there will be a very tough degree of pain that will take place."
The final debt ceiling increase in the agreement would also be subject to a congressional vote of disapproval that can be vetoed by Obama.
The agreement calls for both houses of Congress to vote on a balanced budget amendment to the Constitution, though it does not make a further increase in the debt limit subject to congressional passage of such an amendment -- something tea party conservatives were initially demanding.
In a key concession to Democrats, benefits from entitlements including Social Security, Medicaid, Medicare -- as well as veteran's benefits -- will be exempt from any immediate cuts.
Leaders on both sides of the aisle have openly conceded that the deal is far from perfect.
Senate Majority Leader Harry Reid, D-Nevada, emphasized Monday that "no one got what they want" and "everyone had to give something up."
But this "is a great stride forward" that shows "we can succeed not in spite of our divided government but because of it," he said.
A recent CNN/ORC International Poll revealed a growing public exasperation with the entire debate over the debt ceiling. At the same time, however, it showed a public sharply divided along partisan lines -- much like their elected representatives in Washington.
According to the July 18-20 survey, Democrats and independents largely remain open to a number of different approaches to raising the debt ceiling. Republicans, however, draw the line at tax increases, and a narrow majority of them oppose raising the debt ceiling under any circumstances.
INDICATOR VALUE
STOCH (14) ↑ 90.95
RSI (14) ↑ 74.22
MACD (9) ↑ 25.52
PAR SAR (9) ↑ 1606.90
EMA (20) ↑ 1609.25
EMA (50) ↑ 1591.81
today
RANGE 1630.00 – 1680.00
Support Resistance
1 1620.00 1680.00
2 1605.00 1700.00
Short Medium Long ----------S2 S1 Pivot Point R1 R2
Bullish Bullish Bullish 1599.98 1629.62 1645.63 1675.27 1691.28
i assume today will be small corection
if gold today stay 1655-1659 it will be up 1664 target R1 1675
if gold stay 1650 -1652 it will be down to 1645