The ITrend Oscillator takes the complex, traditional Ichimoku Cloud system and compresses it into a clean, modern momentum oscillator. It shows you the exact directional force of the market while keeping your main chart completely uncluttered.
1. Understanding the Subwindow
1. Understanding the Subwindow
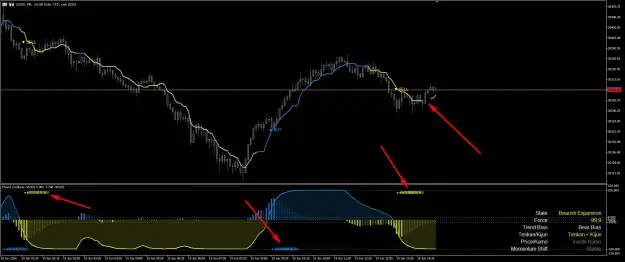
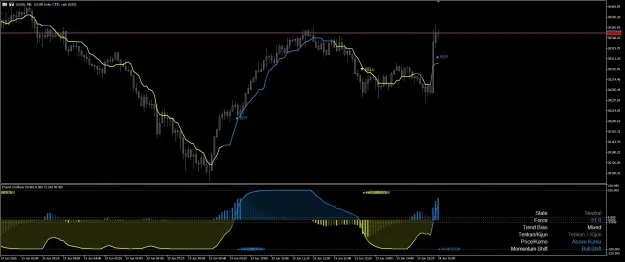
- The Zero Line (Equilibrium): When the force line is above 0, the market is in Bullish (Buy) territory. When it drops below 0, the market is in Bearish (Sell) territory.
- Soft Force Fill (The Cloud): The shaded area expands and contracts to show you how aggressive the current trend is. A thick, dark fill means high volume and strong momentum.
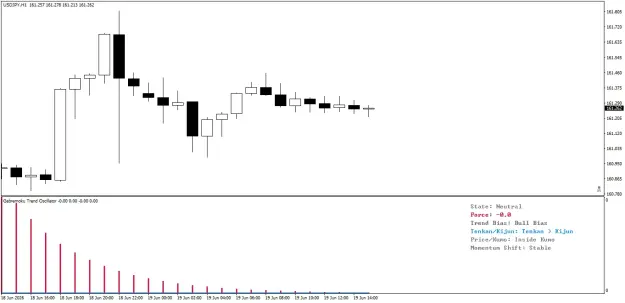
- The Dashboard: Provides an instant snapshot of the market phase. It reads the Ichimoku logic for you, confirming if the short-term trend (Tenkan/Kijun) matches the long-term trend (Cloud Position).
2. The Core Signals
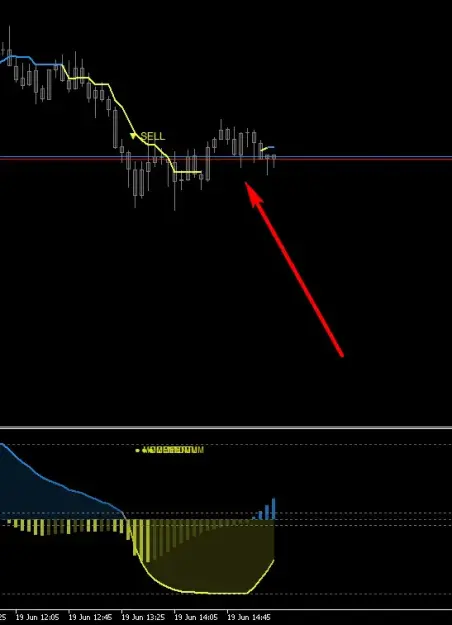
- ▲ BUY / ▼ SELL Signals: These print directly on your main chart when the oscillator force officially crosses the zero line. This indicates a confirmed, structural shift in the market trend.
- ● MOMENTUM Dots: These print in the oscillator subwindow. They act as an Early Warning System. If you are in a massive BUY trend, and the bullish force suddenly drops sharply, a Momentum dot will print. This tells you the rally is losing steam before the trend officially reverses.
3. How to Trade the Setup
- High Probability Entries: Only take ▲ BUY signals when the Dashboard confirms a Bull Bias and Above Kumo. Only take ▼ SELL signals when the Dashboard confirms a Bear Bias and Below Kumo.
- Taking Profits: When you are riding a strong trend and a ● MOMENTUM dot appears, this is your signal to either take partial profits, or tighten your Stop Loss. The market is warning you that exhaustion is setting in.
Attached Image (click to enlarge)
Attached File(s)
1