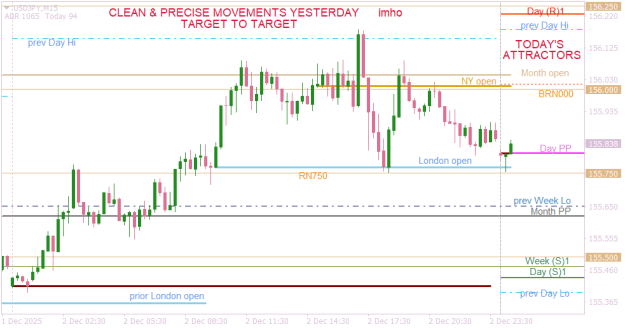
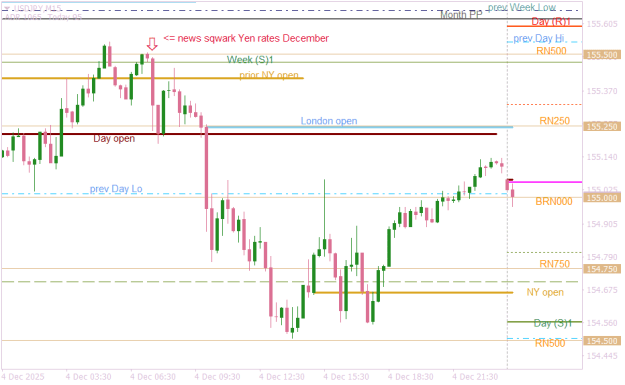
Outside of the mid-Asia news Squawk re potential Yen rates lol,
it was, a fairly standard day of market mechanics by all accounts imo
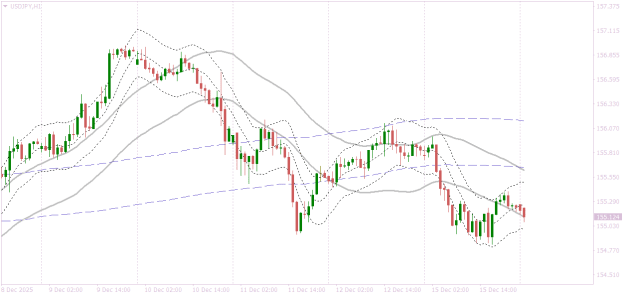
(ie got to Adr just before new York open)
I used to trade the GJ every evening..and it was one of the first Forex pairs I traded back in 2004ish...huge spreads back then.
But it moved like the dickens lol...I was like a dog chasing my tail or the mailman
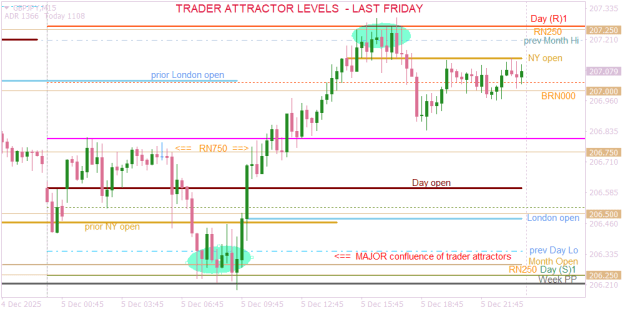
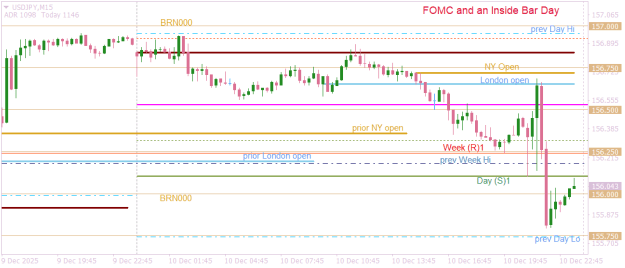
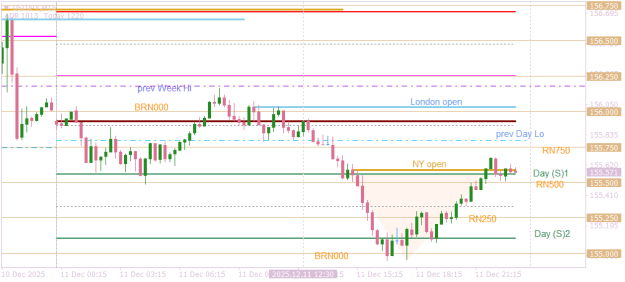
One thing that will always be on my GJ chart and something I am always aware of on any chart is BRN Big Round numbers.
and in particular with the GJ it just loves the quarter numbers as well.
First thing that jumped out was what I have circled... Trading can be as complicated or simple as we make it..
Whether your flying a Cessna 172 or a 747 your still flying...Whatever trips your trigger.
Attached Image (click to enlarge)
Markets are Mirrors,,Mastery of craft is mastery of self
Been quietly reading here for months, absorbing more than posting. Finally something clicked hard enough that I feel I have to throw it into the pot.
Last week I stripped every single line, zone, MA, and indicator off my charts. Literally nothing but raw candles on 5 min and 15 min (no higher TF context either, just to see what would happen).
What I saw was almost embarrassing in its simplicity: Price does NOT respect anything until the moment liquidity on one side has been completely cleaned out. The “respect” we think we see is actually just the exact point where the last resting stops/retail limit orders get eaten. After that, the move is free to continue in the most efficient straight line possible until the next pool shows up on volume profile or fixed range profile.
In other words: Support/resistance only exists in our heads until it’s raided. The only real levels are the ones that haven’t been touched in the current cycle, because they still contain trapped orders. Once they’re taken, the level is dead until it’s re-accumulated again weeks or months later.
It lines up perfectly with what many of you have been saying for years: the market is always seeking the path of least resistance, but that path is defined purely by where the orders actually sit, not by some mystical Fibonacci or round number religion.
Been quietly reading here for months, absorbing more than posting. Finally something clicked hard enough that I feel I have to throw it into the pot. Last week I stripped every single line, zone, MA, and indicator off my charts. Literally nothing but raw candles on 5 min and 15 min (no higher TF context either, just to see what would happen). What I saw was almost embarrassing in its simplicity: Price does NOT respect anything until the moment liquidity on one side has been completely cleaned out. The “respect” we think we see is actually just the...
Ignored
Good observations... One thing to keep in mind is we the retailer are the small fish.. The market "generally" is fueled by the volume of the larger traders..
And these traders are much more sophisticated than retail... There is no round number religion but what I can tell you is if you are to look into these larger traders.. Institutions etc,,they use alot more sophisticated tools such as options.
Crude Oil is a great example..if your not observing round numbers your missing the boat... Why is that...take a look at options and their strike prices etc..What do you see ? and this goes with all markets.. The heaviest volumes are normally whole numbers. You simply wont see large Option orders at say 58.26
they will be 58.00 or most likely 60.00
There is a very big difference in Fibs and whole numbers... One is price the other is a subjective number.
Good job on just watching the candles...price is after all the one thing we all agree on and I think more should just observe to help
themselves understand in whatever way makes sense to each of us.
Cheers
Markets are Mirrors,,Mastery of craft is mastery of self
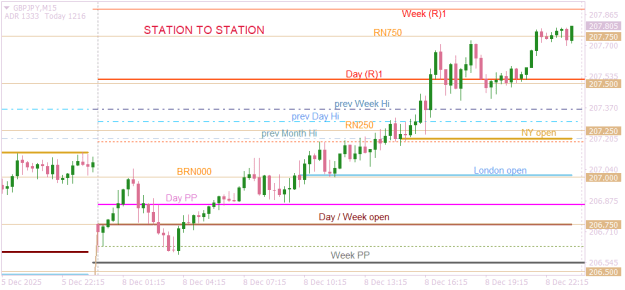
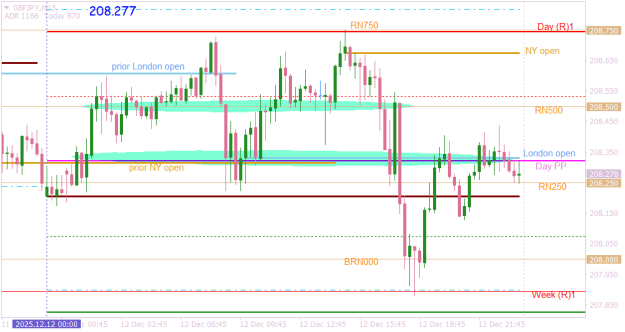
The key to many locks, if I may say so myself is
From years of observation ....
Where are traders (ie liquidity in AND liquidity out) ATTRACTED
and is this visible (day after day, after day)
and are these horizontal price levels known as each new day begins
Now, if you see a confluence of Trader Attractors in the morning then
maybe
...
The key to many locks, if I may say so myself is From years of observation .... Where are traders (ie liquidity in AND liquidity out) ATTRACTED and is this visible (day after day, after day) and are these horizontal price levels known as each new day begins Now, if you see a confluence of Trader Attractors in the morning then maybe ... Trade safe, trade well all GBPJPY , {image}
Ignored
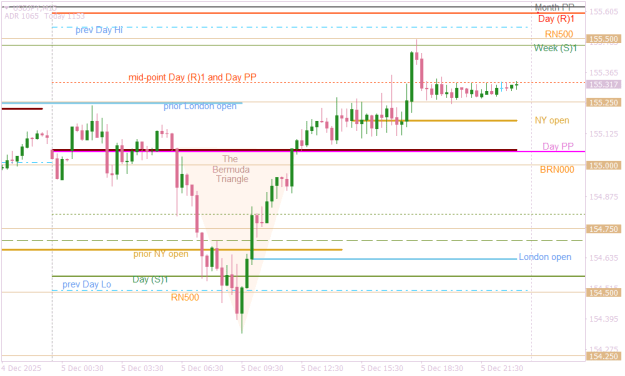
First thing when I see your chart Pete is I think Wyckoff(ish) looking lol
Markets are Mirrors,,Mastery of craft is mastery of self
{quote} First thing when I see your chart Pete is I think Wyckoff(ish) looking lol
Ignored
Spot on Kev, it's all Wyckoff in the markets in the end (imho)
Especially the "spring"
(fake'n'flips hahaa)
AND
of course the Composite Man maybe running the whole show
The only issue I had absorbing Wyckoff was
that the graphic doesn't (well can't)
show an X or Y axis
so we have no intraday references to either PRICE or TIME
two important factors (again just imho)
Once Wyckoff can be thrown across, or under, ACTUAL price (as horizontal lines)
as well as Sessions etc (TIME)
then we have a current picture of where in each (wyckoff) cycle we are
(accumulation, pullbacks/aggregations, and distribution)
And then, as always imo
there is no ONE way to trade all this, or one way which is BEST
which means
it all comes down in the end to US
the Trader
{quote} Spot on Kev, it's all Wyckoff in the markets in the end (imho) Especially the "spring" (fake'n'flips hahaa) AND of course the Composite Man maybe running the whole show The only issue I had absorbing Wyckoff was that the graphic doesn't (well can't) show an X or Y axis so we have no intraday references to either PRICE or TIME two important factors (again just imho) Once Wyckoff can be thrown across, or under, ACTUAL price (as horizontal lines) as well as Sessions etc (TIME) then we have a current picture of where in each (wyckoff) cycle...
Ignored
The Composite Man ! When I first discovered that term I thought how brilliant was Wyckoff to coin that.
Excellent material it is... He is the Ghost in the machine
Markets are Mirrors,,Mastery of craft is mastery of self
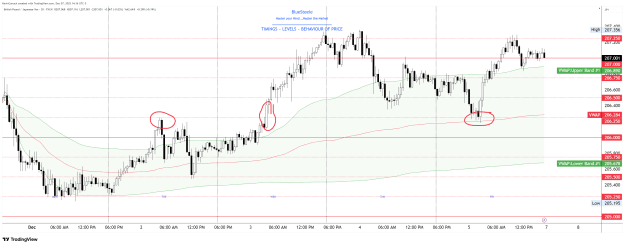
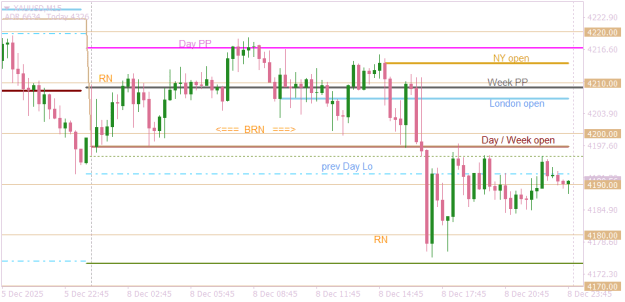
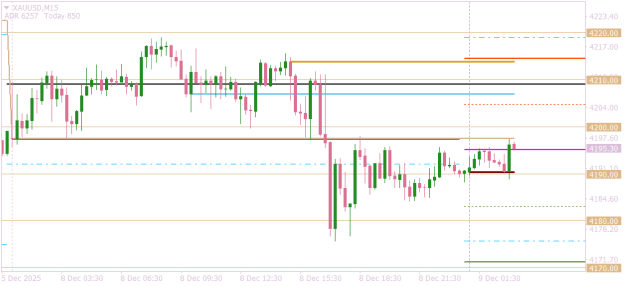
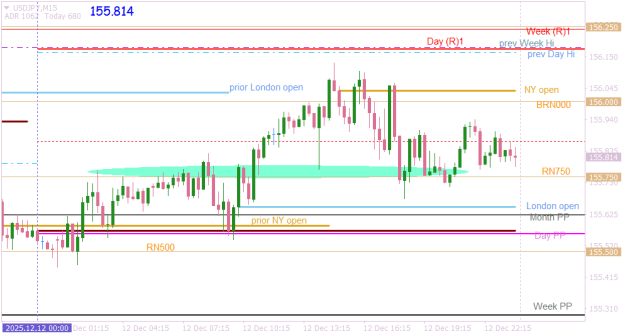
Quick update on GOLD with todays attractors in place now.
Where is it off to, who knows, not me (I've never traded this product)
Looks to be in the accumulation (aggregation) stage to me bouncing between the Day PP, Week open and the Round Number, while absorbing ALL the buys & sells
until the new reckoning (hahaa)
That way a trader can see where the next target is (both above & below) as the day builds & progresses
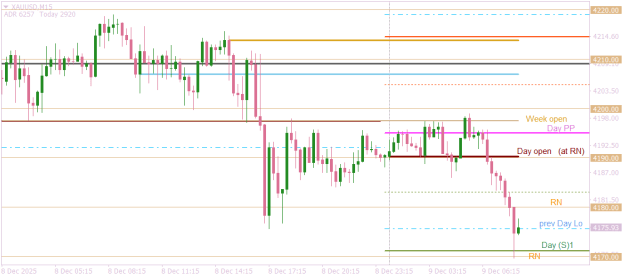
You can use the standard (imho) industry attractors such as hi's-lo's, round numbers, pivs, opens (sessions, days, weeks), maths lines
OR
Use your OWN template to see how market interest (attraction) occurs as the candles begin to build.
No one way to trade our market, or one way that is best I reckon.
End result comes from OURSELVES, the Trader, not our screens or maths so WE better find what works best for us.
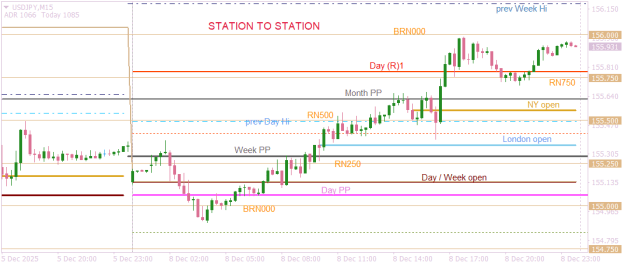
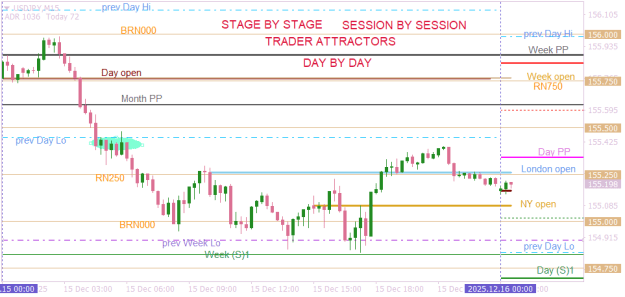
Station to station (to station)
Day after day
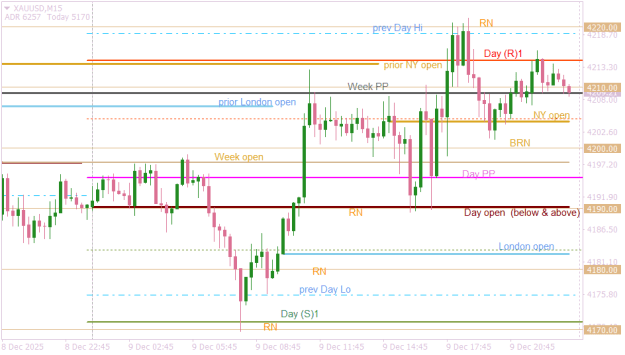
No surprises again below (imho)
While how you trade it, or anything, is your own doing always.
YOU, the trader, are the difference imo, not the markets, not the method, take responsibility for your (our) own actions ...
and then
trade safe & trade well all
Same market mechanics, imo,
I called the chart 'very little variation' (ie all the usual trader target attractors)