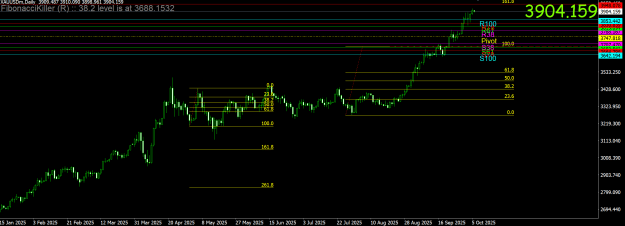
haven't seen a chart like this in my entire life. I am repeating when gold rises like this for days and days and months and months something big is going to break in the short term.
now this chart says 3948 is where this picture should stop but it can stop at 4000-4200-5000 who knows. for now stay out of gold is my recommendation on focus on yen pairs where the setups are clear and it generally respects those. gold has gone out of hands
Dislikedhaven't seen a chart like this in my entire life. I am repeating when gold rises like this for days and days and months and months something big is going to break in the short term. {image}Ignored
Attached Image (click to enlarge)