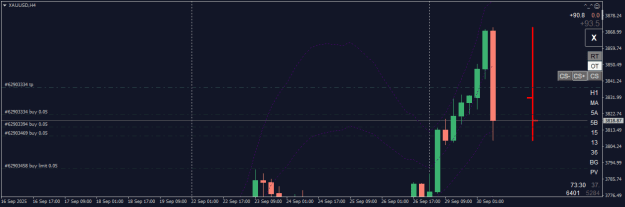
{quote} sell low with expection of M1 liquidity yesterday All buy out, when i showoff something it always be like this {image}
Ignored
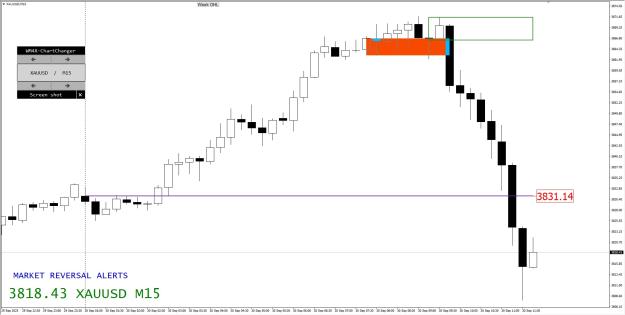
Wait for H4 close in 1.2 hours, full TP reached, this should be a nice sell signal with confirmed top, i do nothing for now, waiting a sign of buy or sell continue, if D1 close below 3k8 then hell yeah, next month gonna be fun fun fun fun!!!!
I am not back, i leave the buy and sell setup here for today, but here people can't see candles with only one color that transform that as bias.
It hurt inexperience traders such coments changing the short term bias by this reason.
1h ago we will to the moon, and now we go where?
Please...
{quote} I am not back, i leave the buy and sell setup here for today, but here people can't see candles with only one color that transform that as bias. It hurt inexperience traders such coments changing the short term bias by this reason. 1h ago we will to the moon, and now we go where? Please...
Ignored
By some reason price was fighting 10m at this price and close below by tiny points... 3816.630
Now untill Ny short term has changed.
{quote} I am not back, i leave the buy and sell setup here for today, but here people can't see candles with only one color that transform that as bias. It hurt inexperience traders such coments changing the short term bias by this reason. 1h ago we will to the moon, and now we go where? Please...
Ignored
we need ppl like you bro Not to give signals but to analyze the market. For me, this is the hardest thing.
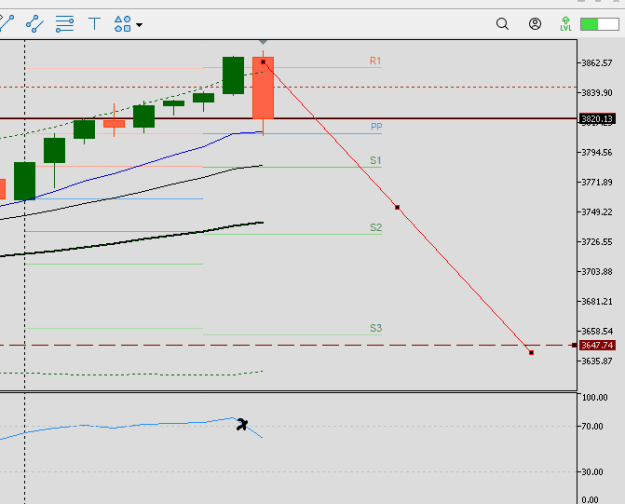
{quote} Speaking of colors, anytime price is below today's OPEN, the daily is forming a red Pin Bar. Wouldn't that be an awesome HTF sell signal going forward, new month and all, and from the ATH. Price action and patterns for sure. {image}
Ignored
Normally yes, but no consistency in my oppinion.
I simple validate with demand broken....
Not necessary go bearish straight forward, should come back 3839.545 despite first use this most likely this demand as a breaker to fall more points.
{quote} Normally yes, but no consistency in my oppinion. I simple validate with demand broken.... Not necessary go bearish straight forward, should come back 3839.545 despite first use this most likely this demand as a breaker to fall more points. London can be seeking 3799.805 zone
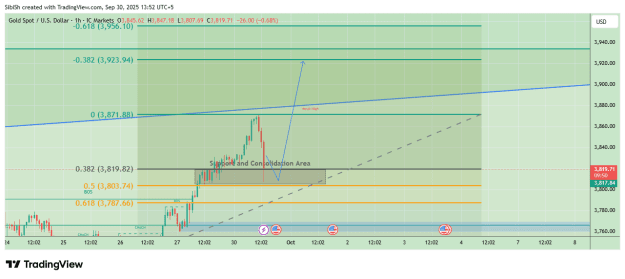
Gold Latest and Detailed Analysis Gold is currently trading around 3830, after testing the higher zone near 3870–3880. The chart shows a pullback from the highs, and price is now entering a support & consolidation area around 3819–3805 (Fib 0.382–0.5 zone). This zone is crucial because it aligns with trendline support and previous breakout levels. If buyers defend this region strongly, gold has potential to resume upward momentum toward 3870–3880 (recent swing high) and then 3920–3955 (Fib extension and resistance zone). On the downside, if 3800–3790...
Ignored
15m and 30m timeframes fib is at 0.5 hasnt closed under it either
"Death created time to grow the things that it would kill"
{quote} Im sorry but: - 1st: Your analysis mean nothing if you not making any money or it do not go in the way of market, there is many circumstance in market, without proper plan, it doesnt mean anything lol. - 2nd: you are idiot, first of all, you are talking about DXY with out looking at chart and FX currency pair, that was lol, it is breaking downward. Yes! But it obvious tracing back quite hard but gold does not, which can clear be seen with XAUEUR pair! {quote} {quote} - 3rd: i dont think you have any idea here, obviously you are clueless...
Ignored
you’re a very rude person and I’m suprised that you’re old enough to trade the market with the mannerisms you portray.
when i showoff something it always be like this {image}
Ignored