TP & SL Tool: Risk Reward Ratio Calculator RRR MT4 | Prop Firm Protector: Trade Assist Prop Firm Plus TF Expert MT4 | Money Management + DrawDown Protector: Trade Panel Prop Firm Drawdawn Limiter Pro MT4 |Get a free Expert Advisor license via Telegram and WhatsApp
What Is Price Equilibrium (EQ)?
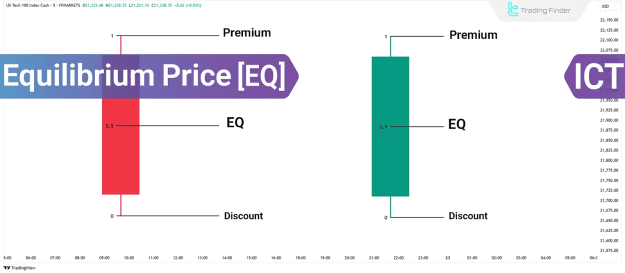
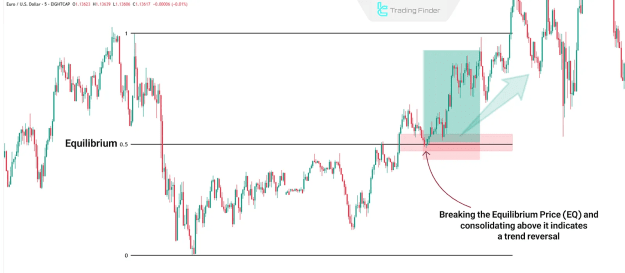
EQ, or Equilibrium, is calculated as the 0.5 Fibonacci level spanning the distance from a candle's wick high to its wick low. This midpoint serves as a pivotal reference for gauging the probable direction of price movement in subsequent trading periods.
- If price interacts positively with this level and holds above it, the existing trend is likely to persist.
- Conversely, a confirmed break and close below EQ suggests a potential phase change or a trend reversal.
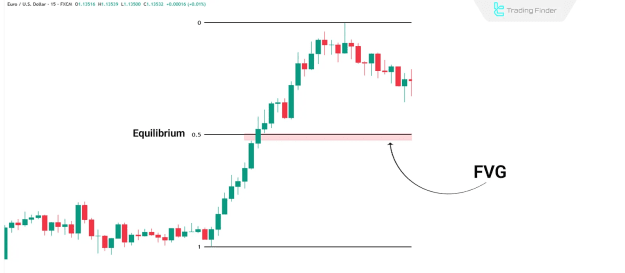
The importance of Price Equilibrium amplifies when integrated with other ICT elements, such as Fair Value Gaps (FVG) or Order Blocks (OB), situated within either half of the range. This synergistic approach helps traders identify sensitive price zones for potential entry and exit points.
How to Use EQ in Daily Analysis?
Price Equilibrium (EQ) serves as an analytical tool to ascertain probable market direction by combining observed price behavior with key liquidity zones. Daily trading applications of EQ in the ICT style typically involve a systematic approach:
- Analyzing the previous day's candle.
- Identifying EQ and PD Arrays in the relevant zone.
- Confirming a Change in the State of Delivery.
Analyzing the Previous Day's Candle
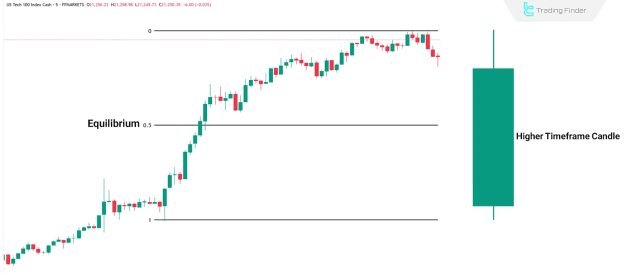
The analytical process commences by measuring the entire range of the preceding day's candle, from its wick high to its wick low. The midpoint, represented by the 0.5 Fibonacci level, establishes the EQ. The primary objective here is to observe the market's response to this specific EQ level. If the subsequent day's price sustains above EQ or shows a positive reaction, the current trend is likely to continue. A break and close below EQ, however, indicates a potential phase shift or a deeper market correction.
Identifying EQ and PD Arrays in the Active Zone
Once the previous day's EQ is established, either the upper or lower half of the candle's range becomes the primary reference zone, contingent on the prevailing directional bias. Within this active zone, traders should diligently search for PD Arrays (Premium and Discount Arrays), which include:
- Fair Value Gap (FVG)
- Order Block (OB)
- Opposing Candle
- Protected Highs and Lows
The concurrent presence of these elements alongside EQ significantly elevates the probability of price reacting in the anticipated direction. For instance, in a bullish trading setup, an FVG or OB located in the upper half of the range above EQ would function as a potential support zone.
Confirmation via Change in the State of Delivery
For a trade entry to be justified, the mere presence of EQ and PD arrays is insufficient. There must be a discernible shift in price behavior, unequivocally confirmed by:
- Price closing above a significant bearish candle.
- Breaking a key candle in alignment with the directional analysis.
- Penetrating and subsequently rejecting from an FVG.
This confirmed change signifies that the market is transitioning out of an accumulation or retracement phase and is resuming its primary trend, thereby validating a trade entry.
Examples of Using EQ in ICT Style
The market's reaction to EQ frequently dictates the directional bias for forthcoming trading sessions, forming the cornerstone of trade decisions.
Holding EQ and Trend Continuation
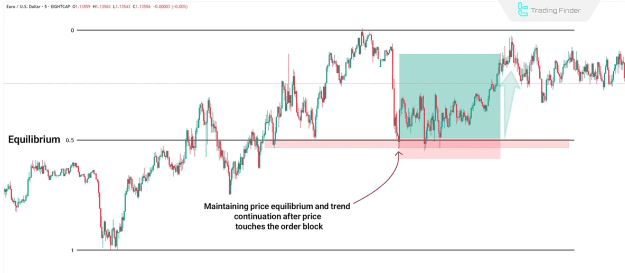
When price demonstrates respect for and holds the 0.5 Fibonacci level of the previous day's candle (EQ), the continuation of the current trend becomes highly probable. This pattern is often reinforced by price closing above a Fair Value Gap or an Order Block. With such confirmation, traders can establish entries within the half of the range that preserved EQ, strategically placing their stop-loss orders behind the nearest support or resistance levels.
Breaking EQ and Reversing Direction
Should price break below EQ and confirm this breach, it strongly suggests a potential phase change (e.g., a transition from expansion to retracement, or from a trending market to a ranging market). This often coincides with price anchoring to significant liquidity zones. In such scenarios, traders may adjust their directional bias and seek trading opportunities in the opposing direction.
Multi-Timeframe EQ Analysis
Price Equilibrium is a fractal concept, meaning its applicability extends across all timeframes.
- Daily EQ is utilized to ascertain the overall market direction.
- 4H EQ is employed for mid-structure evaluation.
- 1H EQ is used for precise entry timing.
Traders can either apply a single EQ or leverage a confluence of multiple EQs to validate their trading setups.
Aligning EQ Structures for Higher-Confidence Setups
Trading setups that demonstrate an alignment of EQ levels across multiple timeframes offer heightened reliability. For instance, if the daily EQ is respected and the 4H EQ also reacts within the same area, traders can then utilize 1H candles for refined entry points. This multi-timeframe alignment within the ICT methodology significantly enhances the accuracy of trade entries.
Common Mistakes When Using EQ
Incorrect interpretation or calculation of EQ can lead to flawed market structure analysis and suboptimal trade entries.
Expecting Return to Premium/Discount in Expansion Phase
During an expansion phase, price typically does not revert to premium or discount zones. Assuming a full retracement to these zones during expansion is a common error and can result in premature or counter-trend entries. The focus should instead remain on the active half of the range.
Using Candle Body Instead of Wick for EQ Calculation
In ICT, EQ is precisely measured from the wick high to the wick low, not from the candle body. Relying on the candle body for EQ calculations will result in inaccurate Equilibrium levels and consequently, flawed analysis.
Conclusion
Price Equilibrium (EQ) within the ICT methodology is a dynamic tool for gauging market reactions across various phases, rather than a static price level. The market's directional intent becomes significantly clearer whether price holds or breaks EQ.
The true efficacy of EQ materializes when it is analyzed in conjunction with liquidity zones and candlestick behavior. Without structural confirmation, EQ alone lacks validity. Its analytical value is considerably amplified when aligned with order flow and utilized across lower timeframes.