TP & SL Tool: Risk Reward Ratio Calculator RRR MT5 | Prop Firm Protector: Trade Assist Prop Firm Plus TF Expert MT5 | Money Management + DrawDown Protector: Trade Panel Prop Firm Drawdawn Limiter Pro MT5 |Get a free Expert Advisor license via Telegram and WhatsApp
How to Calculate a Pivot Point?
The Pivot Point is derived from three key price points of the previous trading day, which collectively reflect genuine market behavior and form the basis for the current day's significant levels:
- High: The highest recorded price of the previous day.
- Low: The lowest recorded price of the previous day.
- Close: The closing price of the previous day.
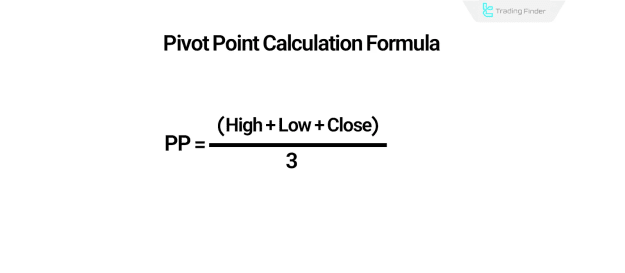
The Pivot Point calculation formula is as follows:
Pivot Point (PP)=3High+Low+Close
This calculated value establishes the central point, from which all subsequent support and resistance levels are derived.
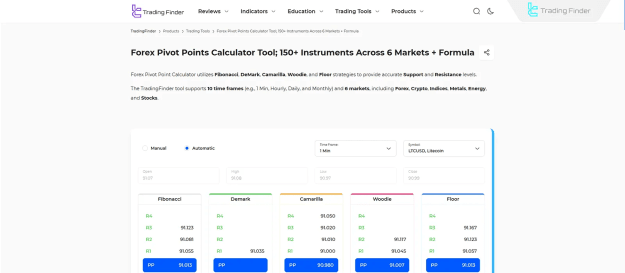
- You can also utilize the TradingFinder Pivot Point Calculator Tool for easy calculation.
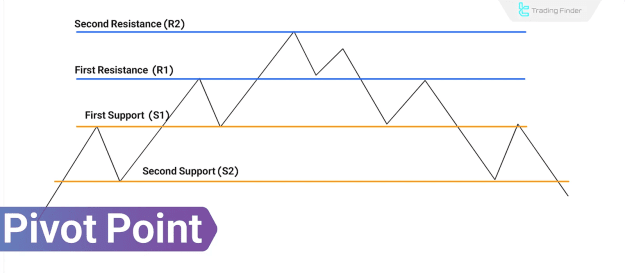
Support and Resistance Levels at a Pivot Point
Calculating Resistance Levels in a Pivot Point
Resistance levels represent specific price zones where the likelihood of an upward price trend halting or reversing increases. These levels are typically considered opportune areas for traders to sell or reduce existing long positions. The formulas for calculating resistance levels are:
- R1 (First Resistance) = (2 × PP) − Low
- R2 (Second Resistance) = PP + (High − Low)
- R3 (Third Resistance) = High + 2 × (PP − Low)
Calculating Support Levels in a Pivot Point
Support levels are price zones where buying pressure is expected to increase, thereby raising the probability of a downward price trend reversing. The formulas for calculating support levels are:
- S1 (First Support) = (2 × PP) − High
- S2 (Second Support) = PP − (High − Low)
- S3 (Third Support) = Low − 2 × (High − PP)
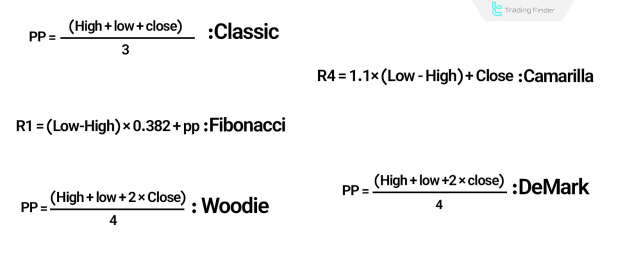
Different Methods of Pivot Point Calculation
Each Pivot Point calculation method possesses a unique structure and is often employed under specific market conditions or tailored to different trading styles. Here are the most common methods:
Standard Pivot
The Standard Pivot, also known as the Classic method, is the most widely adopted model. It is based on the average of the previous day's high, low, and closing prices, providing a fundamental reference point for assessing buying and selling pressure.
- Pivot Point (P) = (High + Low + Close) / 3
Fibonacci Pivot
The Fibonacci Pivot method uses the same initial Pivot Point calculation as the standard method but incorporates Fibonacci ratios (e.g., 0.382, 0.618, 1.000) to determine the support and resistance levels.
- Fibonacci Resistance Levels:
- R1 = PP + 0.382 × (High − Low)
- R2 = PP + 0.618 × (High − Low)
- R3 = PP + 1.000 × (High − Low)
- Fibonacci Support Levels:
- S1 = PP − 0.382 × (High − Low)
- S2 = PP − 0.618 × (High − Low)
- S3 = PP − 1.000 × (High − Low)
Woodie Pivot
The Woodie Pivot method places greater emphasis on the closing price compared to the standard method, making it more sensitive to recent market action.
- PP = (High + Low + 2 × Close) / 4
Camarilla Pivot
The Camarilla Pivot method focuses on intraday price movements and employs fixed multipliers to calculate four resistance levels and four support levels. It is particularly well-suited for volatile markets, especially for scalping and reversal trading strategies.
- Example Formula for R4:
- R4 = 1.1 × (Close − Low) + Close
DeMark Pivot
Unlike other methods, the DeMark Pivot method adjusts the high and low based on the previous day's closing price and its relationship to the opening price.
- PP = (High + Low + 2 × Close) / 4
Practical Applications of Pivot Points in Trading
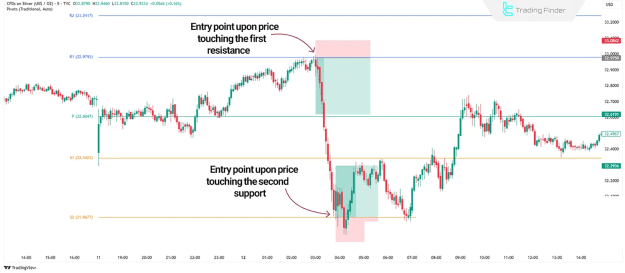
Pivot Points provide a comprehensive framework for establishing the daily market bias, identifying potential reversal zones, and determining price-reaction-based entry and exit levels. Key applications include:
Entry and Exit Points
Pivot Point support and resistance levels delineate zones where price is highly likely to react or experience a breakout. Traders can strategically adjust their positions in accordance with these anticipated price movements.
Setting Take-Profit and Stop-Loss
The R1, R2, S1, and S2 levels are considered ideal zones for placing take-profit and stop-loss orders, given the higher probability of price reactions at these points. Typically, a stop-loss order is positioned just beyond a broken support or resistance level.
Market Direction Analysis
If the price consistently remains above the Pivot Point throughout the trading day, the market generally exhibits a bullish bias. Conversely, if it stays below the Pivot Point, the prevailing trend is considered bearish. This directional insight helps in defining potential buy or sell signals.
Combination with Indicators
Pivot Points gain greater efficacy when combined with other technical indicators such as the Relative Strength Index (RSI), Moving Average Convergence Divergence (MACD) Indicator, or various moving averages. For instance, an RSI divergence near R2 or a moving average crossover around the Pivot Point can serve to validate an entry or exit signal.
Conclusion
The Pivot Point is a powerful numerical tool, derived from the previous day's price data, that effectively identifies key entry, exit, and potential reversal zones. While price often reacts significantly to the main PP level, a sustained break and hold above R1 or below S1 typically signals a continuation of the prevailing trend.
For enhanced entry accuracy, combining Pivot Points with structural confirmations observed on lower timeframes is highly recommended. The choice of Pivot Point method (Standard, Fibonacci, Woodie, or Camarilla) should be carefully selected to align with the specific market volatility and individual trading style.