TP & SL Tool: Risk Reward Ratio Calculator RRR MT4 | Prop Firm Protector: Trade Assist Prop Firm Plus TF Expert MT4 | Money Management + DrawDown Protector: Trade Panel Prop Firm Drawdawn Limiter Pro MT4 |Get a free Expert Advisor license via Telegram and WhatsApp
Calculation Formula for Williams %R
The formula used to compute the Williams %R is:
Williams %R = (Highest High – Close) / (Highest High – Lowest Low)
Definitions of formula components include:
- Highest High: The maximum price within the selected time frame (commonly 14 periods)
- Lowest Low: The minimum price within the same period
- Close: The closing price of the current candle
Benefits and Drawbacks of Using Williams %R
Prior to integrating this indicator into your strategy, consider its main advantages and limitations.
Benefits
- Generates rapid signals for trading decisions
- Simple structure and straightforward interpretation
- Can be effectively combined with other technical indicators for improved accuracy
Drawbacks
- Generates false signals during strong trending markets
- Being a leading indicator, signals can often appear prematurely without additional confirmations
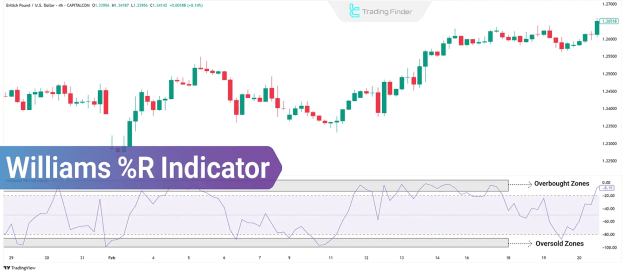
Williams %R Oscillation Range
The Williams %R operates within a defined range:
- Its values fluctuate from 0 to -100
- 0 to -20 signifies an overbought condition
- -80 to -100 indicates an oversold condition
Applications of Williams %R in Trading
Identifying Overbought and Oversold Levels
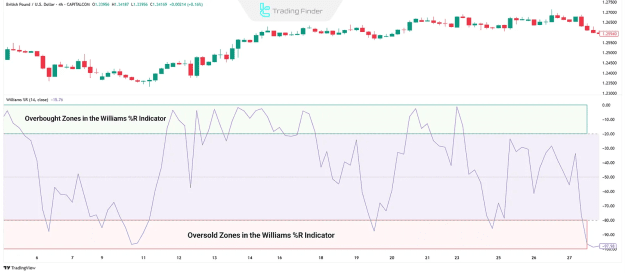
The primary function of the Williams %R indicator is to detect market extremes:
- A reading above -20 suggests the market is overbought, indicating a potential reversal or price correction.
- A reading below -80 implies the market is oversold, suggesting the possibility of a bullish reversal.
Reversal Signal Generation
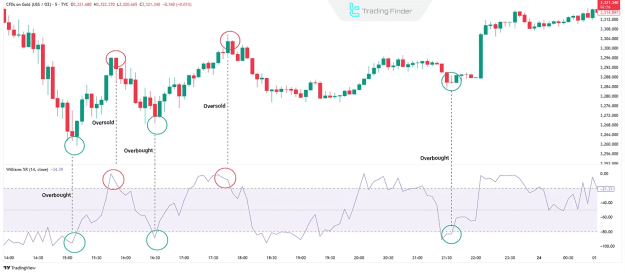
Movement across overbought and oversold thresholds provides potential reversal signals:
- A sell signal occurs when the indicator crosses below -20
- A buy signal is generated when the indicator moves above -80
Confirming Market Trends
Traders often utilise Williams %R to validate current market trends:
- In uptrends: The indicator frequently moves between -20 and -50, supporting bullish continuation.
- In downtrends: It typically oscillates between -50 and -80, confirming ongoing bearish sentiment.
Williams %R Trading Strategies
Divergence Strategy
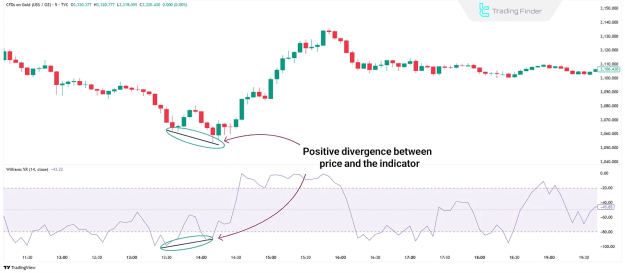
Using divergence between price movement and Williams %R readings is a robust strategy:
- Positive Divergence: When price creates a lower low while Williams %R forms a higher low, indicating a potential bullish reversal.
- Negative Divergence: When price records a higher high but Williams %R forms a lower high, suggesting a possible bearish reversal.
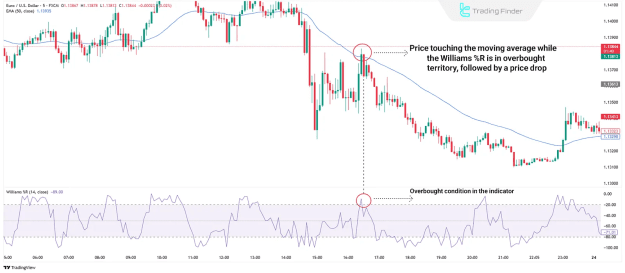
Integration with Moving Averages
Combining Williams %R with Moving Averages enhances trading strategy effectiveness:
- During uptrends (price above 50-period MA): Focus on buy signals generated by Williams %R.
- During downtrends (price below 50-period MA): Prioritise sell signals aligned with market direction.
Best Practices for Using Williams %R Effectively
To optimise the use of Williams %R in trading decisions, consider the following:
- Adjust the indicator period: Although the standard period is 14, testing with 9 or 21 periods may yield better results in specific markets such as forex or cryptocurrency.
- Combine with price action analysis: Signals from Williams %R are more reliable when confirmed by candlestick patterns or key support and resistance levels.
- Confirm with volume analysis: The effectiveness of signals increases when aligned with volume spikes supporting the indicator direction.
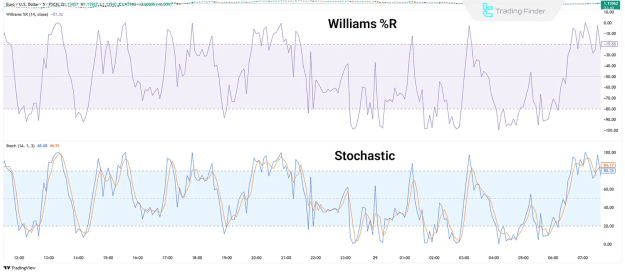
Key Differences Between Williams %R and Stochastic Oscillator
While both indicators are similar in purpose, they differ in their structural and functional characteristics:
- Range: Stochastic Oscillator ranges between 0 and 100, whereas Williams %R operates from 0 to -100.
- Responsiveness: Williams %R generally reacts faster to price changes compared to the Stochastic Oscillator.
- Structure: Williams %R is plotted as a single reversed line, while the Stochastic Oscillator comprises two lines (K and D) used for signal generation.
Conclusion
The Williams %R indicator is a valuable momentum-based tool for identifying overbought and oversold conditions in financial markets. Its strategic application, particularly when combined with price action analysis, volume confirmation, and moving averages, can provide traders with deeper insights into market reversals and trend continuations, enhancing the accuracy of their trading decisions.