TP & SL Tool: Risk Reward Ratio Calculator RRR MT4 | Prop Firm Protector: Trade Assist Prop Firm Plus TF Expert MT4 | Money Management + DrawDown Protector: Trade Panel Prop Firm Drawdawn Limiter Pro MT4 |Get a free Expert Advisor license via Telegram and WhatsApp
What is a Simple Moving Average (SMA)?
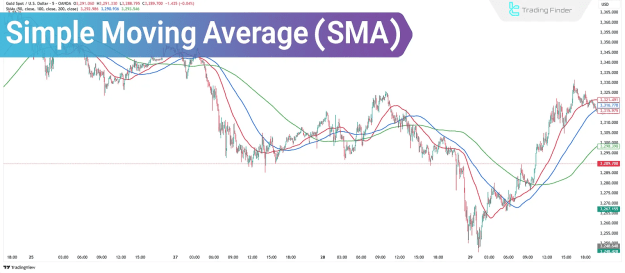
The SMA serves as a key indicator for understanding market direction. By assigning equal weight to all data points within a defined timeframe, the SMA effectively smooths out price volatility, making it particularly useful for identifying long-term trends. Its deliberate lag in reacting to sudden price shifts positions it as a reliable indicator for stable trend analysis rather than short-term fluctuations.
Advantages and Disadvantages of the Simple Moving Average
When integrating the Simple Moving Average into a trading strategy, it's crucial to acknowledge its strengths and limitations.
Advantages:
- Simplicity and ease of use: The SMA is straightforward to understand and apply.
- Trend identification: It excels at identifying the prevailing direction of a market trend.
- Smoothing out price noise: The SMA helps in removing random price fluctuations, offering a clearer market view.
- Detecting support and resistance zones: It can act as a dynamic level of support or resistance.
- Usable across different timeframes: Traders can apply the SMA to various chart periods, from short-term to long-term.
Disadvantages:
- Lagging in response: Due to its averaging nature, the SMA reacts slowly to new price information.
- Low sensitivity to real-time fluctuations: It may not capture rapid price changes effectively.
- Potential trend misidentification: In choppy markets, the SMA can generate misleading signals.
- Inaccurate signals: Relying solely on the SMA can lead to false signals.
- Less effective in highly volatile markets: Its smoothing characteristic can be a hindrance during periods of extreme price swings.
How to Calculate the Simple Moving Average (SMA)
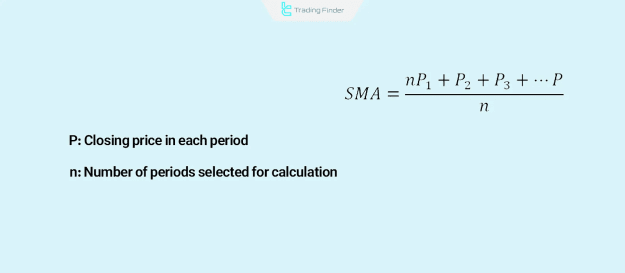
The calculation of the Simple Moving Average is based on a fixed formula that gives equal weighting to each data point within the chosen period. The formula for SMA is:
SMA=Number of periodsSum of closing prices over a specified period
This formula ensures a consistent and smoothed representation of price action over time.
Applications of Simple Moving Average (SMA) in Technical Analysis
The primary application of the SMA is to filter out price volatility, making it an excellent tool for identifying and confirming long-term trends. While not ideal for short-term or rapid price movements, its continuous line can also function as a dynamic support and resistance level, adapting to price changes.
How to Use the Simple Moving Average (SMA) in Technical Analysis
Effective utilization of the SMA involves aligning its application with a trader's specific strategy. For instance, in trend-following approaches such as swing trading, applying the SMA on higher timeframes can yield more reliable signals. The SMA can be used independently or, more commonly, in conjunction with other indicators or multiple SMAs for enhanced confirmation. However, relying on a single indicator is generally discouraged due to the potential for inaccuracies.
Trading Example Using the Simple Moving Average (SMA)
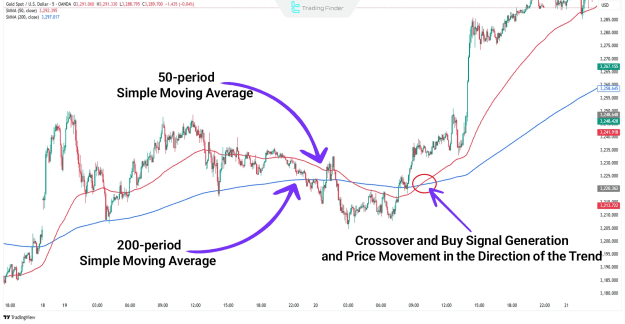
A common strategy involves using two SMAs with different periods. For example, consider a 50-period SMA and a 200-period SMA. A popular buy signal is generated when both SMAs are positioned below the current price, and the 50-period SMA crosses above the 200-period SMA. This "golden cross" often indicates a strengthening uptrend. Conversely, a "death cross" (50-period SMA crossing below 200-period SMA) can signal a downtrend.
Trading Strategies Using the Simple Moving Average
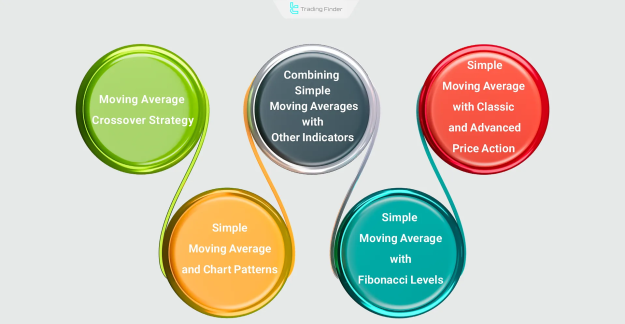
The versatility of the Simple Moving Average allows for its integration into various trading strategies focused on identifying trends, potential reversals, and key support/resistance levels. Some effective SMA-based strategies include:
- Crossover strategy of multiple SMAs: Utilizing the interaction between different SMA periods to generate buy/sell signals.
- Combining SMA with other indicators: Enhancing signal reliability by using SMA alongside tools like the Relative Strength Index (RSI) or MACD.
- Blending SMA with classic and advanced price action: Interpreting SMA's position relative to candlestick patterns and chart formations.
- Integrating SMA with chart patterns: Confirming the validity of patterns such as triangles, flags, or head and shoulders.
- Using SMA with Fibonacci levels: Identifying potential support/resistance at Fibonacci retracement or extension levels in conjunction with the SMA.
Difference Between SMA and EMA
While both are types of moving averages, the Simple Moving Average (SMA) and the Exponential Moving Average (EMA) differ in their weighting of price data. The SMA provides a smooth, linear representation by equally averaging prices over a period, making it suitable for long-term trend analysis. In contrast, the EMA gives more weight to recent price data, making it more responsive to current market movements. This responsiveness makes the EMA better suited for short-term, volatile trading environments where quick reactions are essential.
Best Settings for the Simple Moving Average
Given its primary use in long-term analysis, common SMA settings include 20, 50, 100, and 200 periods. These settings are often used to identify major trends and significant support/resistance levels. Some experienced traders also explore other periods like 9, 14, 26, and 103 for specific strategies or asset classes. Ultimately, the most effective SMA settings are those customized to a trader's individual strategy, the specific asset being traded, and the prevailing market conditions.
Conclusion
The Simple Moving Average (SMA) is an indispensable technical indicator for identifying dynamic support and resistance levels and discerning long-term price trends. By assigning equal weight to each data point within its chosen period, the SMA effectively eliminates price noise, offering a clear and smoothed perspective on market direction. Its simplicity and effectiveness make it a cornerstone for many trend-following trading strategies