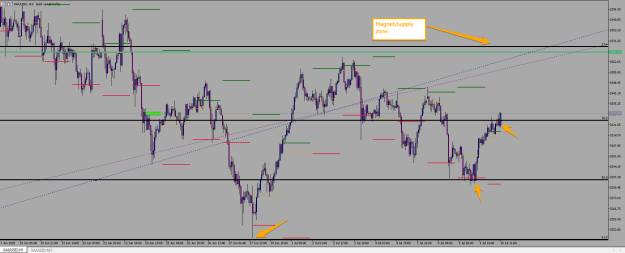
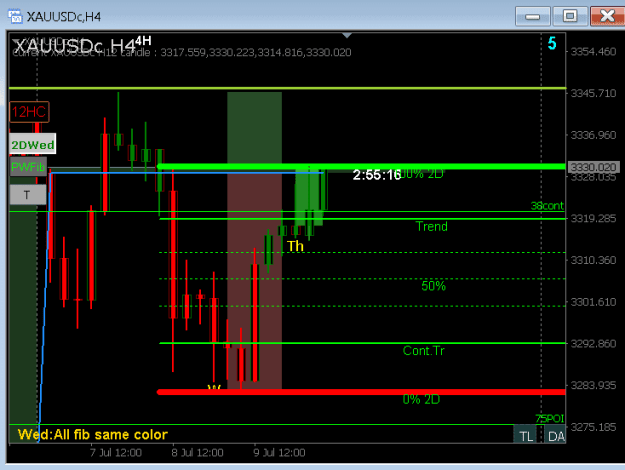
{quote} Whats the green / red /white - is that a regression channel or TMA bands? And the blue line, is that a donchian high low? {image}
Ignored
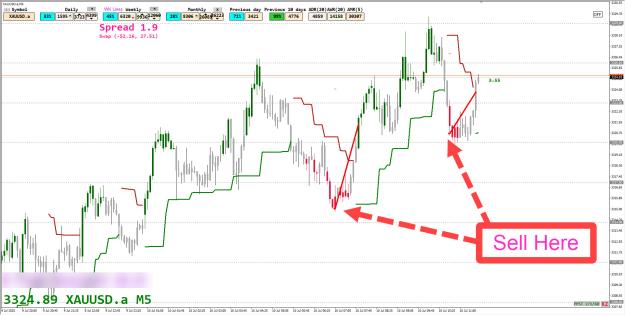
Blue line is Daily open and the white is a high/low indicator which does re-calculate like most indicators,however settings can be changed depending Candle/Renko and brick size and Candle time frame....Red/green line are TMA lines which I have used for years...Works best on Renko.
No one is going to want to help you if you're being rude. It's fustrating when you lose money but if you need help just ask for it.
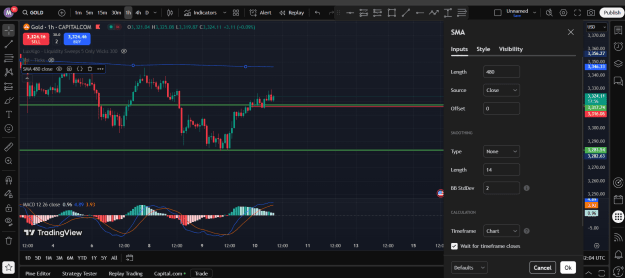
Stick to higher timeframes when it's like this. 1hr with a MACD is all you need but the take profit level and avoiding greed is most likely your problem.
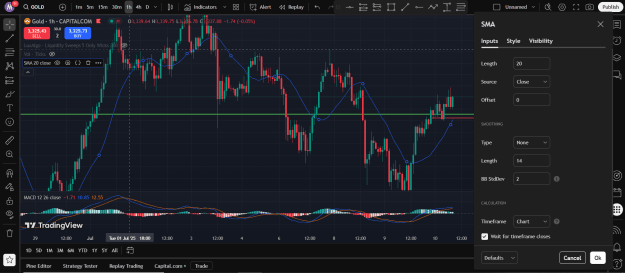
1hr chart, Simple moving average 480 period (its the daily 20 sma)
MACD standard settings, take trades in direction of sma when you have a signal from MACD, you will make a lot of money from this
that in a way covers yesterdays range however unless something crazy happens via data and tariffs that level of drop is very rarely seen in one day on gold. If we do trickle down to 3300 then maybe touch 3290 ish a lot of ground to cover
currently at 3320 as support. Break below for 3310-3300
{quote} No one is going to want to help you if you're being rude. It's fustrating when you lose money but if you need help just ask for it. Stick to higher timeframes when it's like this. 1hr with a MACD is all you need but the take profit level and avoiding greed is most likely your problem. 1hr chart, Simple moving average 480 period (its the daily 20 sma) MACD standard settings, take trades in direction of sma when you have a signal from MACD, you will make a lot of money from this
Ignored
i think i need some help some details about the stratergy and what about the lowertimeframes with the same stratergy or just the higher timeframe because of the lower fake moves and security and any entry rules some video or some sourse to learn thoroughly....
{quote} Supertrend is about 40 - 55%, I like supertrend but isn't this what you normally see? Break and pullback trading, that first one is a buy, possibly the second one but no inducement yet.
Ignored
I'm not complain about any system or indicators; only observing my frustration that the market either stalls or reverses right when my eyes and mind say to enter!
I guess I need to pay more attention to the higher time frames which are all telling to go LONG.
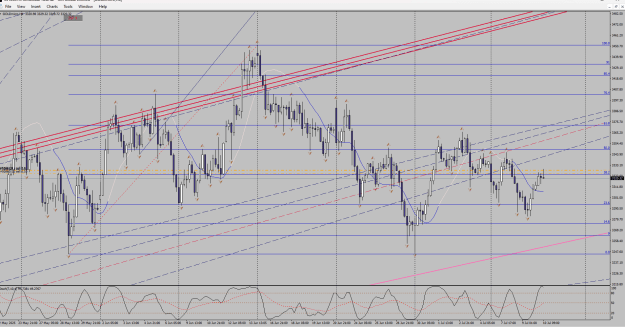
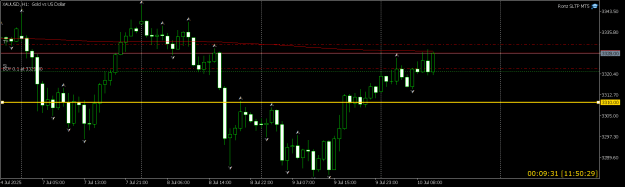
last weekly fib and this week fib is for buy signal,what you guys think?
Many of you will call me crazy,i see quarterly 6 months and even yearly trend also and 6M fib says its buy on 23.6% retracement,the retracement can be deeper,if that is the case then PA will go deep low.
last weekly fib and this week fib is for buy signal,what you guys think? Many of you will call me crazy,i see quarterly 6 months and even yearly trend also and 6M fib says its buy on 23.6% retracement,the retracement can be deeper,if that is the case then PA will go deep low. {image}
Ignored
I am watching for that 3332-3342 area for adding a sell