TP & SL Tool: Risk Reward Ratio Calculator RRR MT5 | Prop Firm Protector: Trade Assist Prop Firm Plus TF Expert MT5 | Money Management + DrawDown Protector: Trade Panel Prop Firm Drawdawn Limiter Pro MT5 |Get a free Expert Advisor license via Telegram and WhatsApp
What is Price Action?
Price Action is a method of financial market analysis that focuses exclusively on the movement of an asset's price over time, without the use of lagging technical indicators. This approach prioritizes raw price behavior to offer a clear, unfiltered view of market dynamics. Traders who utilize price action make their decisions based on a deep understanding of trend analysis, key levels, chart patterns, and candlestick formations.
The primary objective of price action trading is to interpret market behavior and make informed decisions by analyzing the intrinsic supply and demand forces that drive price movements. This analytical style is universally applicable across various financial markets, including the Forex Market, stocks, commodities, and cryptocurrencies, and can be employed across any timeframe.
Key Concepts in Price Action Strategy
Understanding the core concepts of price action is crucial for effective market analysis. These foundational elements help traders decipher the underlying logic behind price fluctuations:
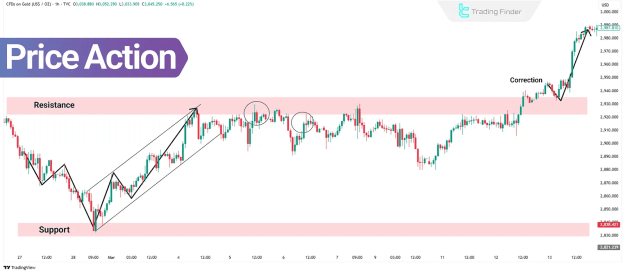
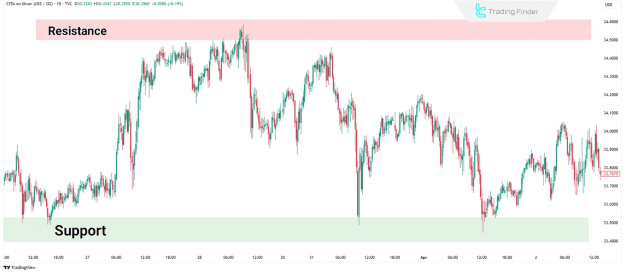
- Support and Resistance: These are fundamental levels where buying or selling pressure is expected to increase, potentially halting or reversing price movements.
- Support is a price level where buying interest is strong enough to prevent further decline.
- Resistance is a price level where selling interest is robust enough to impede further price increases.
- A breakout or reversal at these levels can signal a continuation of the existing trend or a significant shift in market direction.
- Trends: Identifying the prevailing market direction is essential for aligning trading decisions with the overall flow.
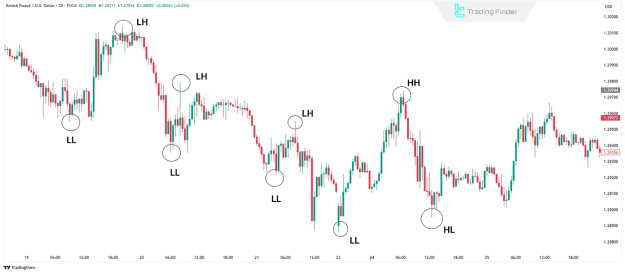
- In an uptrend, prices consistently form higher highs and higher lows.
- In a downtrend, prices establish lower highs and lower lows.
- Detecting swing highs and swing lows is critical for accurate trend identification.
- Trendlines and Price Channels: These graphical tools help visualize market direction and potential trading zones.
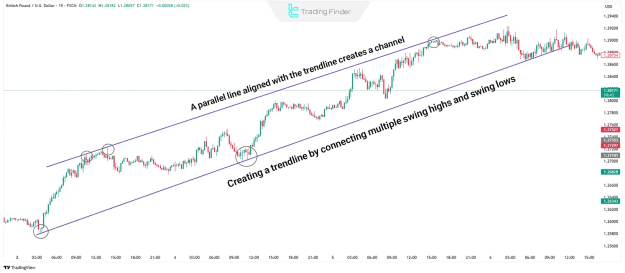
- A trendline connects a series of significant swing highs or lows, indicating the general market direction.
- A price channel is formed by two parallel trendlines that encompass price movement, helping to identify potential buy and sell areas and anticipate breakouts.
- Candlestick Patterns: Individual candlesticks and their formations provide valuable insights into market sentiment and potential price reversals or continuations.
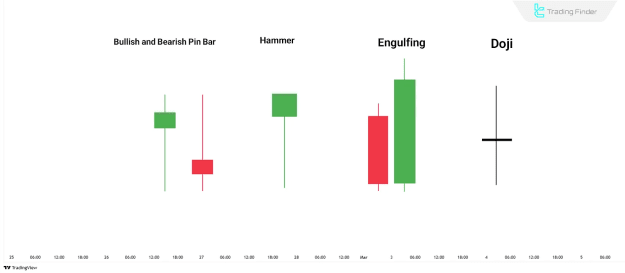
- Pin bars, hammers, and shooting stars are characterized by long wicks and small bodies, signaling price rejection from a particular level.
- The engulfing pattern occurs when one candle completely encloses the previous one, indicating a strong shift in market dominance.
- A Doji candlestick, with its small body, reflects market indecision.
- Chart Patterns: These are recurring formations on price charts that often precede significant price movements, signaling potential reversals or continuations.
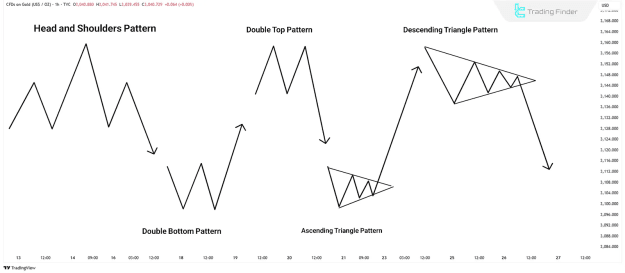
- Head and Shoulders is a classic reversal pattern, often indicating a shift from an uptrend to a downtrend or vice versa.
- Double Top/Bottom patterns suggest a potential trend reversal once their neckline is broken.
- Triangles (ascending, descending, symmetrical) represent periods of consolidation before an anticipated breakout.
- Breakouts: A breakout occurs when the price moves decisively beyond a defined key level or pattern.
- Breakouts accompanied by high volume typically suggest strong momentum and increased reliability.
- Breakouts accompanied by high volume typically suggest strong momentum and increased reliability.
- Reversals and Retracements: Distinguishing between these two types of price movements is crucial for traders.
- A reversal signifies a complete change in the prevailing market direction.
- A retracement is a temporary counter-trend move within an existing trend. Fibonacci tools are frequently employed to identify likely retracement levels.
- Volume and Volatility: These factors provide additional context and validation for price movements and patterns.
- Volume helps confirm the strength and conviction behind price movements.
- Volatility influences the reliability and intensity of identified patterns. For instance, a breakout with both high volume and high volatility is often considered more credible.
How to Use Price Action Effectively
Implementing price action effectively involves a systematic approach to analyzing raw price data:
- Maintain a Clean Chart: Focus solely on candlesticks or price bars, eliminating all technical indicators to ensure an unfiltered view of price.
- Identify Market Structure: Determine whether the market is trending (characterized by higher highs/lows or lower highs/lows) or ranging (moving sideways within defined boundaries) based on swing points.
- Detect Recurring Patterns and Reaction Zones: Identify significant support and resistance levels and recognize common candlestick and chart patterns.
- Analyze Price Behavior at Key Levels: Observe how price interacts with these crucial levels to anticipate potential trend continuations or reversal signals.
- Confirm with Volume and Volatility: Use volume and volatility data to validate the strength and reliability of identified price action signals.
Designing a Price Action Trading Strategy
Developing a robust price action trading strategy involves several key steps:
- Select Specific Patterns: Choose one or more candlestick or chart patterns that align with your trading style (e.g., a bullish pin bar forming at a support level).
- Choose an Appropriate Timeframe: Select a timeframe that suits your trading preferences and objectives.
- Ensure Market Alignment: Confirm that the chosen pattern aligns with the overall market direction or existing trend.
- Define Entry, Stop Loss, and Take Profit: Clearly establish your entry point, a protective stop loss order, and a take profit target before executing a trade.
- Backtest the Strategy: Use historical data to rigorously test the effectiveness and profitability of your developed strategy.
Example Trade Using Price Action
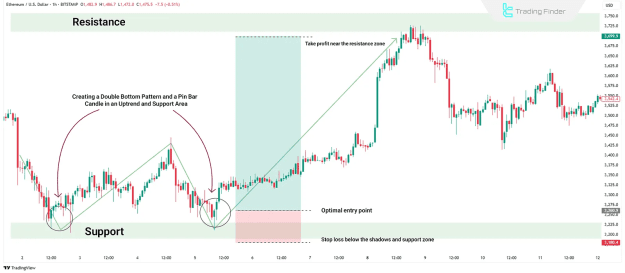
Consider a scenario where a bullish pin bar forms precisely at a significant support level within an established uptrend.
- Entry: The trade is initiated immediately after the bullish pin bar closes.
- Stop Loss: A protective stop loss order is placed just below the low of the pin bar's wick to limit potential losses.
- Take Profit: The take profit target is set near the next identified resistance level, aiming for a favorable risk/reward ratio.
Risk Management in Price Action Trading
Effective risk management is paramount for long-term success in any trading strategy, including price action:
- Stop Loss Placement: Stop losses are typically positioned strategically outside the boundaries of the identified patterns, providing a buffer against minor fluctuations.
- Risk/Reward Ratio: A risk/reward ratio of at least 1:2 is generally recommended, meaning the potential profit is at least twice the potential loss.
- Position Sizing: Position size must be carefully calculated to align with the trader's overall account size and their predetermined acceptable risk level per trade.
Conclusion
Price action is a powerful and highly effective market analysis methodology that centers on the study of raw price behavior and the identification of recurring patterns. A key advantage of this approach is the elimination of the lag often associated with traditional technical indicators. By mastering price action principles, traders can accurately identify trends, locate critical support and resistance zones, and leverage recognizable patterns like pin bars, head and shoulders, and triangles to determine optimal entry and exit points in the market.