



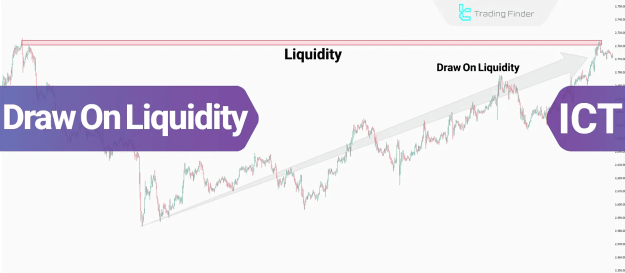
In the Inner Circle Trader (ICT) methodology, a key aspect of Forex Education , price action is fundamentally driven by liquidity. The concept of Draw On Liquidity (DOL) describes instances where price actively targets and utilizes existing market liquidity to facilitate its continued movement. This gravitational pull towards liquidity is a cornerstone of ICT analysis.
TP & SL Tool: Risk Reward Ratio Calculator RRR MT5 | Prop Firm Protector: Trade Assist Prop Firm Plus TF Expert MT5 | Money Management + DrawDown Protector: Trade Panel Prop Firm Drawdawn Limiter Pro MT5 |Get a free Expert Advisor license via Telegram and WhatsApp
What is Draw On Liquidity?
Liquidity tends to accumulate at pivotal market points such as old highs and lows, equal highs and lows, established support and resistance zones, and order block areas. Within the ICT framework, the Draw On Liquidity (DOL) concept refers to the observed price movement towards these specific zones. This movement's purpose is to absorb the necessary liquidity for the price to sustain its current directional bias or initiate a reversal.
The Concept of Draw On Liquidity on the XAU/USD Chart
While the general principles of DOL apply across all financial instruments, their manifestation on a specific chart like XAU/USD (Gold against the US Dollar) provides a practical illustration. On the XAU/USD chart, traders would observe price gravitating towards and interacting with zones of accumulated liquidity, such as previous significant highs or lows, to fuel its next directional move.
Types of Liquidity in the Market
The forex market, and indeed other financial markets, primarily features two critical types of liquidity. Both are integral to thoroughly analyzing the Draw On Liquidity (DOL) concept and understanding price behavior.
Buy-Side Liquidity
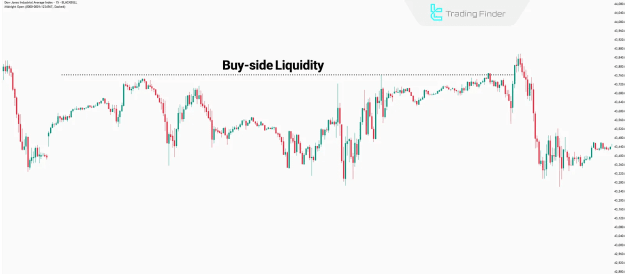
Buy-side liquidity is positioned above the current market price. This area represents a concentration of buy stop orders and the stop losses of existing sell trades. These significant clusters are frequently found near swing highs or established key resistance levels, acting as attractive targets for upward price movements.
Sell-Side Liquidity
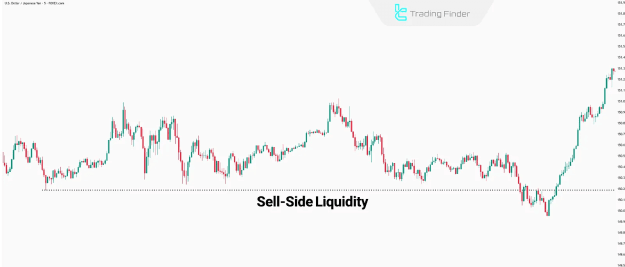
Conversely, sell-side liquidity resides below the current market price. This region is characterized by an accumulation of sell stop orders and the stop losses of existing buy trades. These concentrations are typically located near swing lows or significant support areas, making them prime targets for downward price movements.
Identifying Draw On Liquidity Movement
To effectively identify Draw On Liquidity (DOL) movements, traders must first pinpoint high-liquidity zones. These zones, inherently attractive to price, are identified using core ICT concepts.
Old Highs and Lows
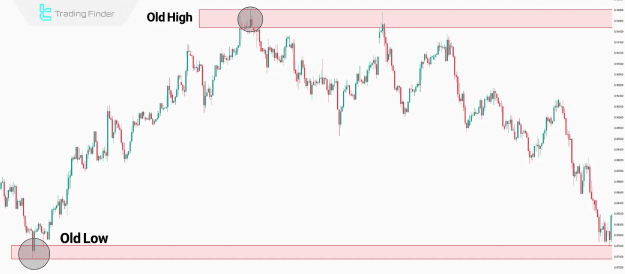
Old highs and lows are distinct price points on a chart where price previously reached a peak or trough and subsequently reversed. These historical levels often serve as primary targets for subsequent Draw On Liquidity (DOL) moves, as they represent areas where significant orders were placed.
Equal Highs and Lows
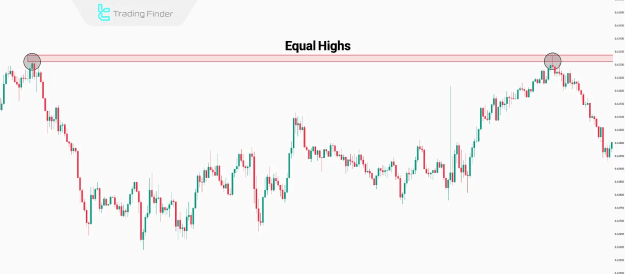
Equal highs and lows are chart patterns where price has repeatedly touched and reacted from the same horizontal price level. Retail traders often place their stop losses just beyond these zones, thereby creating substantial liquidity pools. These pools become ideal targets for Draw On Liquidity (DOL) movements seeking to absorb these accumulated orders.
Fair Value Gap (FVG)
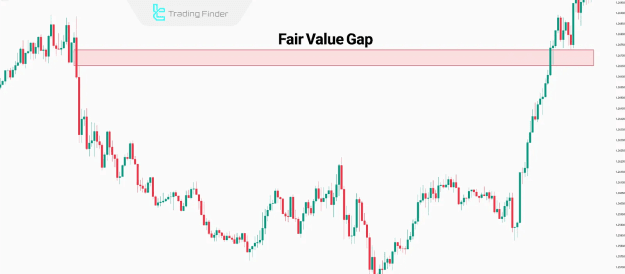
A Fair Value Gap (FVG) denotes a price zone where a significant imbalance between buying and selling pressure has occurred. This imbalance typically results in rapid, one-sided price movement, leaving a noticeable "gap" between candlesticks. This phenomenon leaves numerous orders unfilled within the gap. Consequently, these Fair Value Gaps become highly attractive zones for subsequent Draw On Liquidity (DOL) moves, as price often returns to fill these imbalances.
Pros and Cons of Using Draw On Liquidity
While employing the Draw On Liquidity (DOL) concept can significantly enhance trade execution by clarifying the probable direction of liquidity, it also presents inherent challenges, largely due to its reliance on the presence of liquidity and the necessity for a profound understanding of order flow.
Pros
TP & SL Tool: Risk Reward Ratio Calculator RRR MT5 | Prop Firm Protector: Trade Assist Prop Firm Plus TF Expert MT5 | Money Management + DrawDown Protector: Trade Panel Prop Firm Drawdawn Limiter Pro MT5 |Get a free Expert Advisor license via Telegram and WhatsApp
What is Draw On Liquidity?
Liquidity tends to accumulate at pivotal market points such as old highs and lows, equal highs and lows, established support and resistance zones, and order block areas. Within the ICT framework, the Draw On Liquidity (DOL) concept refers to the observed price movement towards these specific zones. This movement's purpose is to absorb the necessary liquidity for the price to sustain its current directional bias or initiate a reversal.
The Concept of Draw On Liquidity on the XAU/USD Chart
While the general principles of DOL apply across all financial instruments, their manifestation on a specific chart like XAU/USD (Gold against the US Dollar) provides a practical illustration. On the XAU/USD chart, traders would observe price gravitating towards and interacting with zones of accumulated liquidity, such as previous significant highs or lows, to fuel its next directional move.
Types of Liquidity in the Market
The forex market, and indeed other financial markets, primarily features two critical types of liquidity. Both are integral to thoroughly analyzing the Draw On Liquidity (DOL) concept and understanding price behavior.
Buy-Side Liquidity
Buy-side liquidity is positioned above the current market price. This area represents a concentration of buy stop orders and the stop losses of existing sell trades. These significant clusters are frequently found near swing highs or established key resistance levels, acting as attractive targets for upward price movements.
Sell-Side Liquidity
Conversely, sell-side liquidity resides below the current market price. This region is characterized by an accumulation of sell stop orders and the stop losses of existing buy trades. These concentrations are typically located near swing lows or significant support areas, making them prime targets for downward price movements.
Identifying Draw On Liquidity Movement
To effectively identify Draw On Liquidity (DOL) movements, traders must first pinpoint high-liquidity zones. These zones, inherently attractive to price, are identified using core ICT concepts.
Old Highs and Lows
Old highs and lows are distinct price points on a chart where price previously reached a peak or trough and subsequently reversed. These historical levels often serve as primary targets for subsequent Draw On Liquidity (DOL) moves, as they represent areas where significant orders were placed.
Equal Highs and Lows
Equal highs and lows are chart patterns where price has repeatedly touched and reacted from the same horizontal price level. Retail traders often place their stop losses just beyond these zones, thereby creating substantial liquidity pools. These pools become ideal targets for Draw On Liquidity (DOL) movements seeking to absorb these accumulated orders.
Fair Value Gap (FVG)
A Fair Value Gap (FVG) denotes a price zone where a significant imbalance between buying and selling pressure has occurred. This imbalance typically results in rapid, one-sided price movement, leaving a noticeable "gap" between candlesticks. This phenomenon leaves numerous orders unfilled within the gap. Consequently, these Fair Value Gaps become highly attractive zones for subsequent Draw On Liquidity (DOL) moves, as price often returns to fill these imbalances.
Pros and Cons of Using Draw On Liquidity
While employing the Draw On Liquidity (DOL) concept can significantly enhance trade execution by clarifying the probable direction of liquidity, it also presents inherent challenges, largely due to its reliance on the presence of liquidity and the necessity for a profound understanding of order flow.
Pros
- More precise entries: By anticipating where price will target liquidity, traders can pinpoint more accurate entry points.
- Reduced slippage risk: Trading with the identified liquidity flow can minimize the chances of unfavorable price slippage during execution.
- Higher accuracy in stop loss and take profit placement: Understanding DOL allows for more strategic placement of stop-loss orders and take-profit targets, aligning them with liquidity objectives.
- Trading with liquidity flow: This approach aligns trades with the underlying market mechanics, potentially increasing success rates.
- Improved trade timing: Identifying DOL helps in timing trades more effectively by entering when price is poised to move towards liquidity.
- Lower stop-hunt probability: By understanding where liquidity resides, traders can potentially avoid common "stop-hunt" scenarios.
Cons
- Requires advanced knowledge and experience in liquidity analysis: A deep understanding of market microstructure and order flow is essential.
- Possibility of fake breakouts: Price may temporarily move into a liquidity zone only to reverse, leading to false signals.
- Risk of early entry before liquidity grab confirmation: Entering a trade prematurely before the price fully commits to a liquidity grab can lead to losses.
- Difficulty in identifying main liquidity zones in lower timeframes: The significance and clarity of liquidity zones can diminish on lower timeframes, making identification challenging.
- High impact of news on liquidity: Major news events can drastically alter liquidity dynamics, making DOL analysis more complex.
- Uncertainty in identifying valid liquidity levels: Not all perceived liquidity levels are equally significant, requiring discretionary judgment.
Conclusion
In the context of the ICT trading methodology, Draw On Liquidity (DOL) refers to the compelling tendency of price to gravitate towards zones of high liquidity. Key areas for identifying potential DOL setups include old highs and lows, equal highs and lows, and Fair Value Gaps (FVG). While implementing DOL strategies offers the potential for more accurate trade entries and improved risk management, it simultaneously introduces challenges such as the risk of fake breakouts and the imperative for a sophisticated grasp of order flow and overall market dynamics. Mastering DOL requires dedicated study and practical experience to navigate its complexities effectively.
Attached Image(s) (click to enlarge)
Attached File(s)
