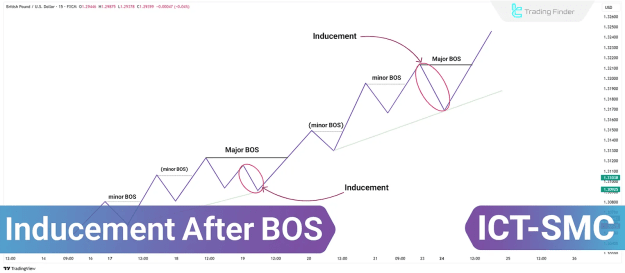
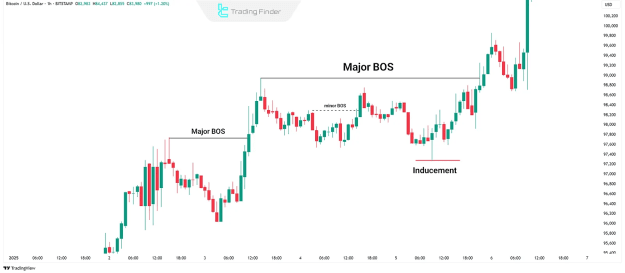
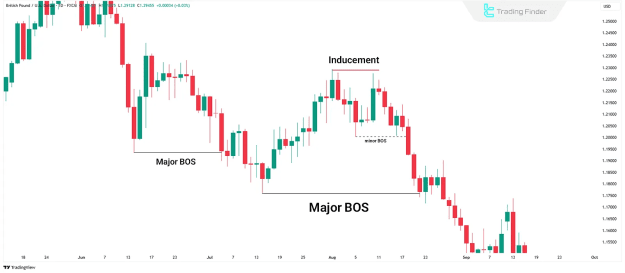
A fundamental component of this strategy involves liquidity harvesting - the deliberate targeting of retail stop-loss clusters. One particularly effective setup occurs following a Break of Structure (BOS), especially when price exhibits continuation without the expected retracement. These strategic areas where stops get hunted are professionally termed Liquidity Inducement Zones.
TP & SL Tool: Risk Reward Ratio Calculator RRR MT4 | Prop Firm Protector: Trade Assist Prop Firm Plus TF Expert MT4 | Money Management + DrawDown Protector: Trade Panel Prop Firm Drawdawn Limiter Pro MT4 |Get a free Expert Advisor license via Telegram and WhatsApp
The Dynamics of Post-Break Liquidity Traps
A genuine Break of Structure manifests when price conclusively breaches a significant technical level with conviction. However, professional traders recognize that the most profitable scenarios often occur when the market:
- Fails to retest the breakout level (creating unfilled liquidity)
- Accelerates beyond the initial break point
- Forms new liquidity pools at extended levels
This creates a cascading effect where traders waiting for traditional pullback entries miss the move entirely, while those chasing the breakout often find themselves trapped at unfavorable levels when the inevitable reversal occurs.
Bullish Market Inducement Patterns
In established uptrends characterized by consecutively higher highs and higher lows, professional liquidity operations follow a distinct protocol:
The Three-Phase Bullish Inducement Sequence
- Structural Confirmation Phase
- Price establishes a clear bullish structure (HH/HL formation)
- Initial break of structure occurs above recent swing high
- Classic traders anticipate retest of breakout level
- Liquidity Void Phase
- Price continues ascent without meaningful retracement
- Creates "unfilled liquidity" below current levels
- Institutions monitor for trapped breakout traders
- Secondary Inducement Formation
- Development of minor structural break (micro BOS)
- Identification of new liquidity pool through fractal analysis
- Final sweep of stops before continuation
Professional Insight: The most reliable entries occur after the secondary inducement formation when price demonstrates rejection from the newly identified liquidity zone.
Bearish Market Liquidity Traps
Downtrends featuring lower highs and lower lows present mirror-image opportunities for institutional traders:
The Bearish Inducement Blueprint
- Structural Breakdown
- Confirmed LH/LL pattern establishes bearish bias
- Decisive break below recent swing low triggers initial stops
- Continuation Without Retracement
- Price extends downward leaving unfilled liquidity above
- Creates psychological pressure on remaining longs
- Trap Spring Mechanism
- Formation of minor structural reclaim (fake breakout)
- Liquidity grab above recent lows
- Subsequent rejection and trend resumption
Critical Observation: The most aggressive selling opportunities typically emerge after the trap spring when price fails to sustain above the inducement zone.
Strategic Implications for Discretionary Traders
- Liquidity Mapping
- Identify probable stop clusters beyond obvious technical levels
- Monitor order flow at previous swing points
- Timing Considerations
- Valid inducement requires time-based confirmation
- Avoid premature entries before liquidity sweeps complete
- Risk Management Protocols
- Position sizing must account for potential fakeouts
- Utilize tiered entry strategies for optimal positioning
Advanced Toolset Integration:
Modern traders combine:
- Volume profile analysis
- Market depth visualization
- Algorithmic order flow indicators
Conclusion
Mastering the Institutional Mindset
The perpetual battle between retail traders and institutional players centers around liquidity dynamics. By understanding:
- How and why inducement zones form
- The behavioral psychology behind stop runs
- The structural signatures of genuine vs. false breaks
Traders can transform from being liquidity providers to liquidity hunters. This paradigm shift represents the fundamental difference between consistent profitability and chronic frustration in financial markets.