I added to the position at 3189 and one position is now locked in the green SL and we are still holding on to the TP target ... We'll see what the Asian session brings ... good luck all
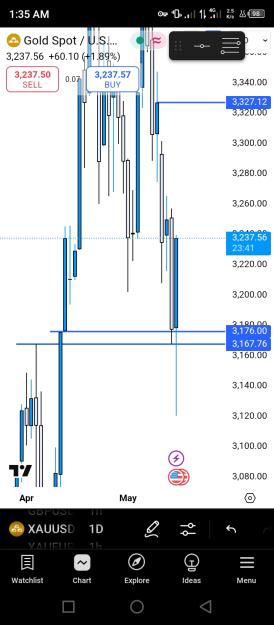
{quote} 3176 done. From current levels 3176 - 3167 possible attraction to 3326 Gap.
Ignored
Today market did something like "it's not cheating if it's just the tip" The saying fits the market as market is always right!
So yeah, Support is still intact it was just the wick
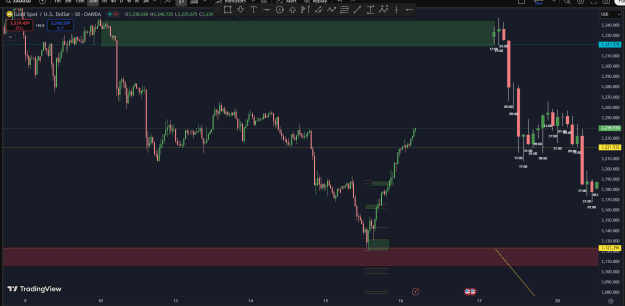
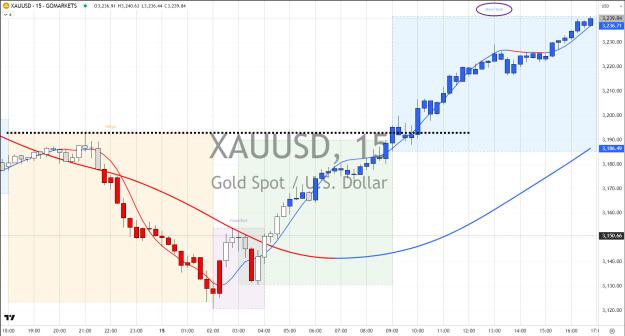
So.. recap Tokyo open around 3191 drop to 3120 before London Open. and from there straight to 3240. drop 71$ Fly back 120$ without corrections. Insane.
Ignored
to be honest not expected at all, i was expecting 3232 and had a sell limit there, but to see pa is about to close the day with a fat big bullish candle, i closed it with loss at 3239.5.
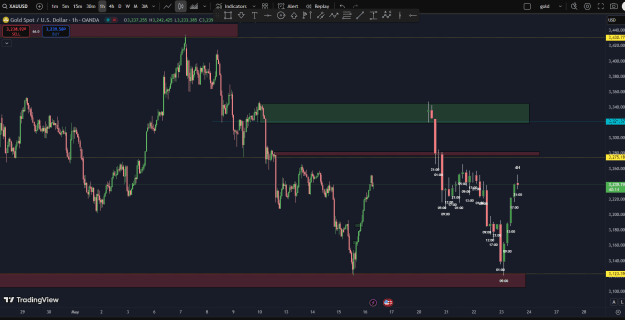
I have few scenarios now, the maximum is pa closing the gap and reversing sharply. If weekly candle closes with strong bullish candle then i will seriously re-consider my bearish bias.
Anyway im not planning to trade gold tomorrow
So.. recap Tokyo open around 3191 drop to 3120 before London Open. and from there straight to 3240. drop 71$ Fly back 120$ without corrections. Insane.
Ignored
Looks like an Initial Balance of the early sessions, USA traders going to do what they do.
Dollar Index just stagnate, so anything with USD will be pushed around.
my indicator says: In M30/H1 timeframe, it is overbougt at 3190+ but in D1 or W1, it is oversold it's very risky to sell because it is looks like the end of bear trend
Ignored
still overbought in M30/H1 timeframe but it is not as much oversold as few hours ago in D1 timeframe.
In next few hours, there could be some small corrections, ranging from 3200-3280
{quote} still overbought in M30/H1 timeframe but it is not as much oversold as few hours ago in D1 timeframe. In next few hours, there could be some small corrections, ranging from 3200-3280
Ignored
Can you explain "overbought" and "oversold" - how you recognize that?
Where did you learn this concept? And how to predict with accuracy those levels?
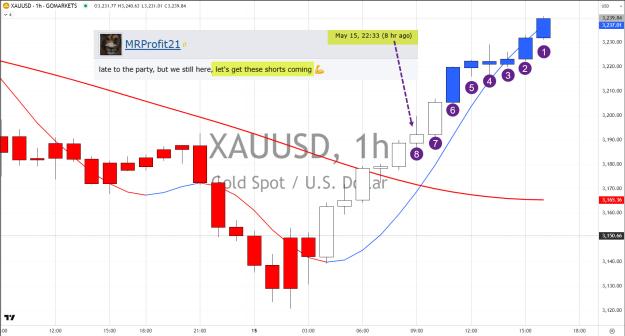
Good Morning Australia.aaaaaaaaaaaaaa In case you wonder why I'm skeptical, this is what I find most days, by starting to read the posts during the 8 hours I was sleeping. Posts like this and everything after it, does anyone find this phenomenon? That is why this forum can be the best predicator of where price is really going. {image} Shorts mean down doesn't it? Early to the party, let's get this short TODAY
{quote} Can you explain "overbought" and "oversold" - how you recognize that? Where did you learn this concept? And how to predict with accuracy those levels? Please share.
Ignored
Im just testing some indicators to see their accuracy and precision, sometimes it gives very mixed signal suggesting short for intraday trading but also saying it is going to be a bull trend (like yestoday). so I interprete it as temporary overbought in the bull trend, so i could just wait for the pull back then long.
the result sometimes is very confusing and can be easily wrong, still needs optimisations.
{quote} Can you explain "overbought" and "oversold" - how you recognize that? Where did you learn this concept? And how to predict with accuracy those levels? Please share.
Ignored
yeah - totally meaningless .. something is at a higher price because the market wants it there .. opposite if it’s in the toilet .. focus more on trade levels or patterns for more consistent results rather than lagging indicators.
the folks that created these indicators are the very people who want you to lose as much money as possible because they work for the brokers hahaha