{quote} I've been trading for 15 years, when starting i had the Lars Ulrich 1980 hair, after 15 years i now own the 2024 Lars Ulrich hair. Thank you gold
{quote} LOL! Please stick around and post more often!
Ignored
Thanks, will do - i've been offline from this forum for years due to too much drama and "See i told you" shit comments. Hope the quality of the comments in the forum is better now, than for 10 years ago
Im a newbie if that isn’t obvious lol, 4h candle looked abit like a hammer to me but obviously still had a decent body so wondering if you think it was enough for a support?
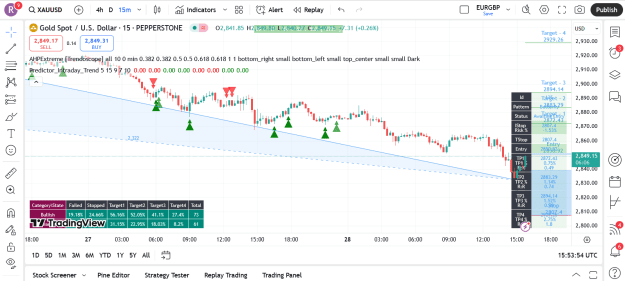
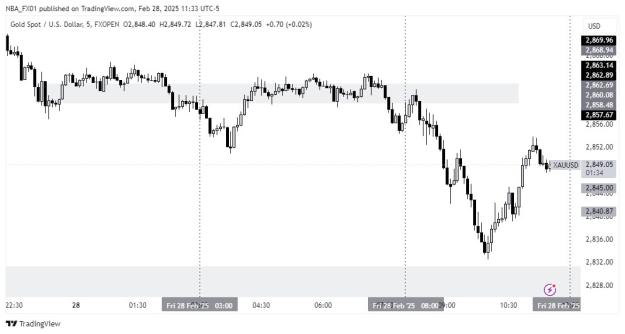
Been keeping track of price movement, and marking out directions since Tuesday , even though I didn’t take them live , because of my trading break !
but I’ve now come to realize that part of the reason for the choppy price action In the last two weeks of February , was because of this sudden bearish move that’s happening , it was a whole higher timeframe new resistance forming , when people where trying to go higher ! … and wanted to get to 3000 overnight !
I’d love to see how march unfolds , I want to see full bodied daily candles which is 2 good trending days in a week… through out march ! …… we need money , we’ve got bigger whips to buy … Gold be nice ….
{quote} Im a newbie if that isn’t obvious lol, 4h candle looked abit like a hammer to me but obviously still had a decent body so wondering if you think it was enough for a support?
Ignored
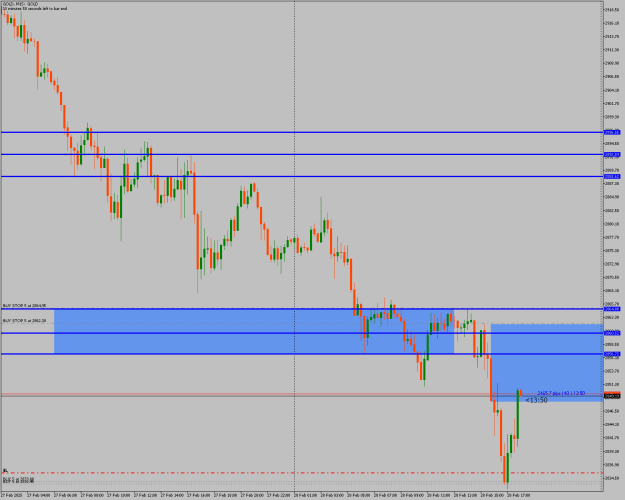
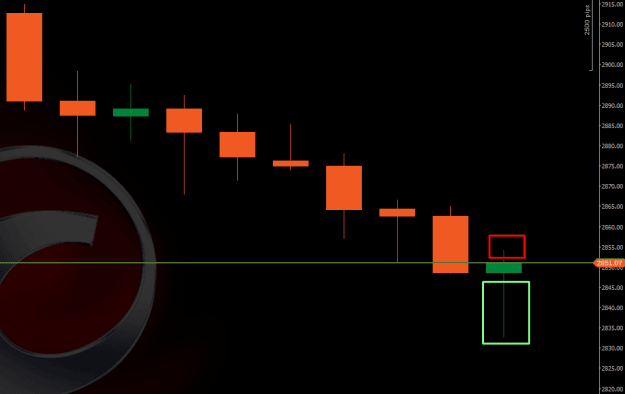
to be a hammer candle, it has to have a long wick and close at the top of its own body. - This is still possible as the candle first closes 19:00 (central european time)
As for now, the candle has wicks in both directions, but the lower wick is longer than upper wick, meaning that there was more buying liquidity in that area + the buying liquidity took place on the 200ma, which is know to be the golden standard for many banks and insitutional traders.
On the screenshot, you will see the candle. Red box meaning sellers liquidity, and green box buyers liquidity.
If its valid as support, is a big question, because liquidity is been taking out all the time in need to fill the market. BUT if this candle holds its form, i would be looking for bullish momentum for next week. This is pure technical, trump is meeting Zelensky later today to talk about a mineral deal, and also the blueprint for a potential peace agreement, which also plays a major role in gold. But for now i would assume there will be a bullish formation next week, due to gold been on a rally, and the overall trend is still very bullish. Perhaps we will not for nearest future see a new ath, but i do think 29xx levels is in the playing cards for next week.
Trade safe, and only take my advice with a grain of salt. I only trade my own money and manage my own risk
Been keeping track of price movement, and marking out directions since Tuesday , even though I didn’t take them live , because of my trading break ! but I’ve now come to realize that part of the reason for the choppy price action In the last two weeks of February , was because of this sudden bearish move that’s happening , it was a whole higher timeframe new resistance forming , when people where trying to go higher ! … and wanted to get to 3000 overnight ! I’d love to see how march unfolds , I want to see full bodied daily candles which is 2 good...
Ignored
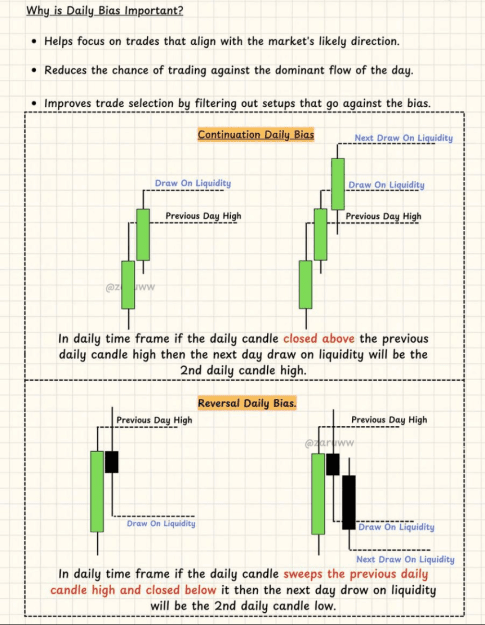
You got the hints. Sharing about the Theoretical D1 narrative for price action.
{quote} to be a hammer candle, it has to have a long wick and close at the top of its own body. - This is still possible as the candle first closes 19:00 (central european time) As for now, the candle has wicks in both directions, but the lower wick is longer than upper wick, meaning that there was more buying liquidity in that area + the buying liquidity took place on the 200ma, which is know to be the golden standard for many banks and insitutional traders. On the screenshot, you will see the candle. Red box meaning sellers liquidity, and green...
Ignored
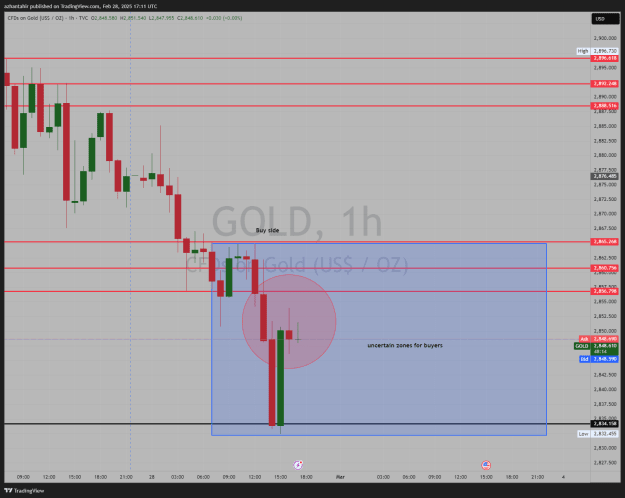
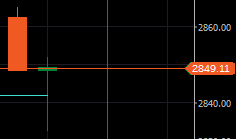
h1 end with draw on liquidity. If H1 gifts another sign, the price may be bearish again.
{quote} h1 end with draw on liquidity. If H1 gifts another sign, the price may be bearish again. {image}
Ignored
It would be lovely to see a break of Europe open price. I still have faith in 4h long wick on 200ema, but I do also except a lot of tug of war in this area due to the highly volatile market. Let's see how 4h close looks like, after that I will lay focus on 1h formation.
{quote} It would be lovely to see a break of Europe open price. I still have faith in 4h long wick on 200ema, but I do also except a lot of tug of war in this area due to the highly volatile market. Let's see how 4h close looks like, after that I will lay focus on 1h formation.
Ignored
H4 still has half an hour before it ends. Hopefully, it going to be. But, we in the end of weekly bias. Would love it if we could start with a new week. It's a new week, with a new month, with a new narrative...IMO..
{quote} You got the hints. Sharing about the Theoretical D1 narrative for price action. {image}
Ignored
I love this image representation you put up regarding what I said earlier , it seems you figured that the daily candles understanding allows traders to increase their win rate , by using the directional bias for a particular day !
very true ; using the daily candles for directional bias , filters unreasonable trades !….. those traders you see trying to catch bulls in a bearish market , it happens to them because they don’t understand draws on liquidity on the daily timeframe highs and lows !
when the daily timeframe directional bias aligns with the , lower timeframe market structure …. BOOM !! you execute !
{quote} I love this image representation you put up regarding what I said earlier , it seems you figured that the daily candles understanding allows traders to increase their win rate , by using the directional bias for a particular day ! very true ; using the daily candles for directional bias , filters unreasonable trades !….. those traders you see trying to catch bulls in a bearish market , it happens to them because they don’t understand draws on liquidity on the daily timeframe highs and lows ! when the daily timeframe directional bias...
Ignored
Yes, a lot of traders don't understand about drawing on liquidity. Only wishing to go there and there without reference. I wish you the best of luck, buddy. It is just a theoretical bias but can be used as a preference.